![]()
![]()
![]()
![]()
![]()
![]()
![]()
![]()
![]()
![]()
![]()
![]()
![]()
![]()
![]()
![]()
![]()
![]()
![]()
![]()
![]()
![]()
![]()
![]()
![]()
![]()
![]()
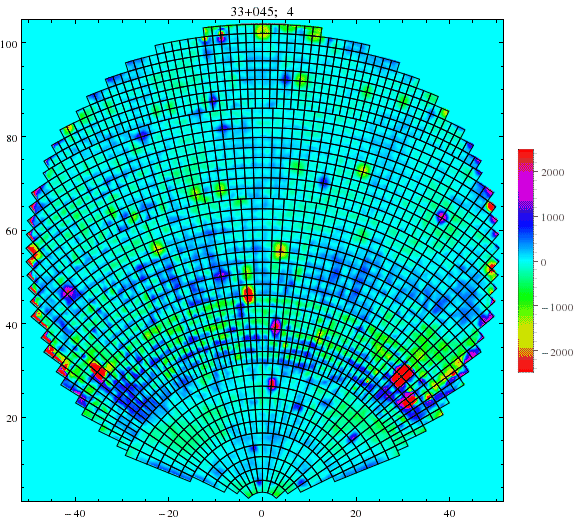
This is the Zernike-removed, ring-subtracted surface error map from the Oct. 4,
2014 GBT holography run. There are quite a few outliers. I tabulated twenty-six
of the worst-offending actuators and intended to mask them out, but the masking
failed for some reason. (I’ll have to fix that.) The units shown on the legend scale
are microns:

![]()
![]()
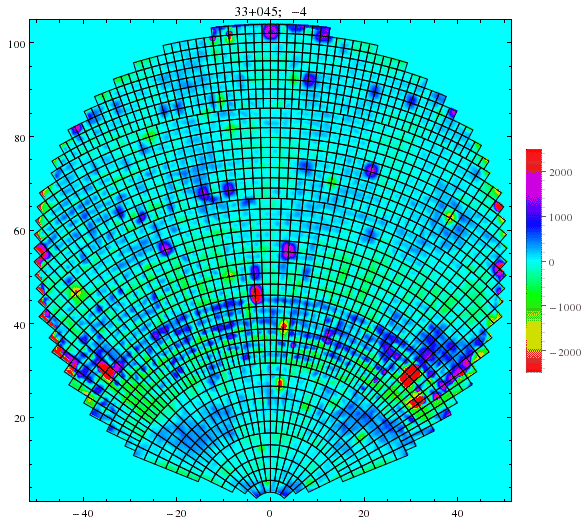
Same display as above, but with the sign flipped in order to reverse the color
scale. Some features are more readily apparent in one display than the other:

![]()
![]()
![]()
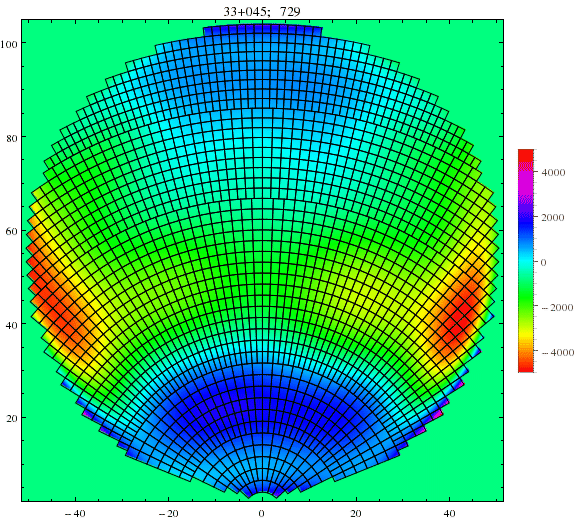
This is the 55-term Zernike fit to the large-scale structure. This is really wierd! Usually
the Zernike fit has peaks of perhaps a millimeter or so, or perhaps only a few hundred microns, and usually the pattern is quite random. In this case, the peak amplitudes are
~4.5 millimeters, and the pattern has a distinct left-right symmetry about the centerl line.
I forgot: is this what the 44-deg FEM gravity model looks like?
![]()
![]()
