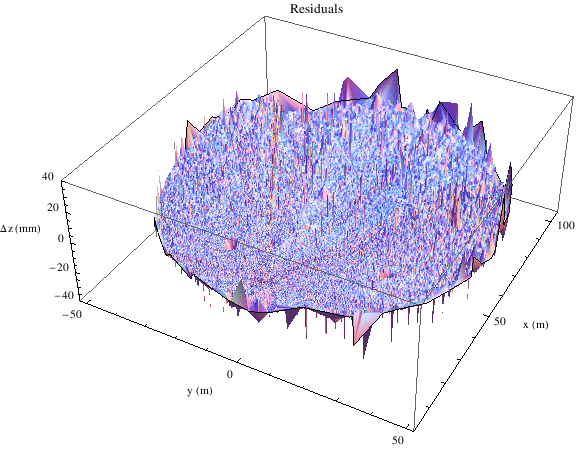
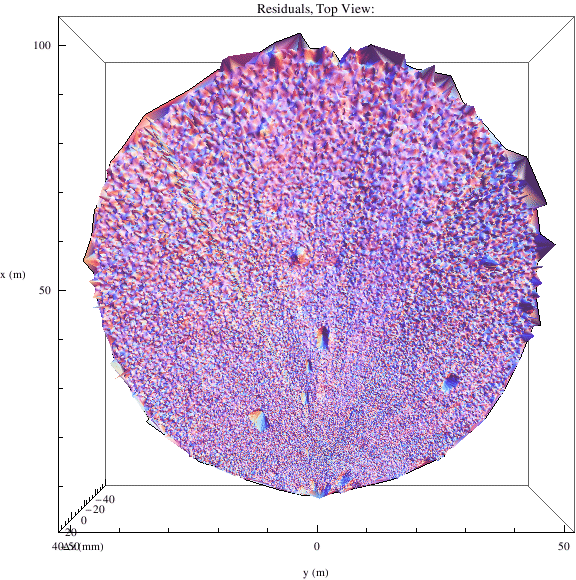
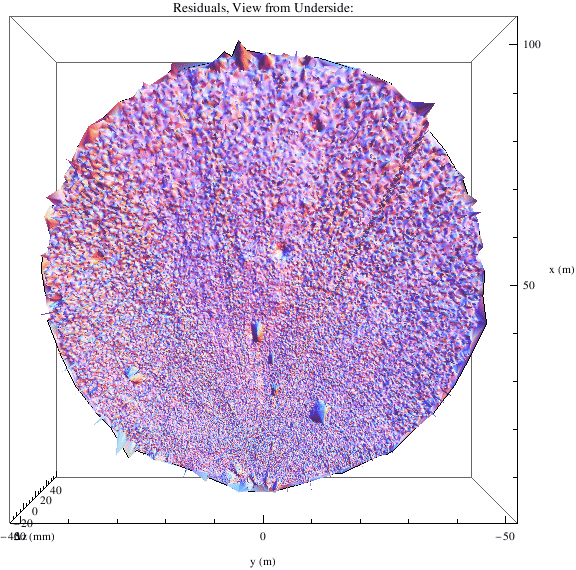
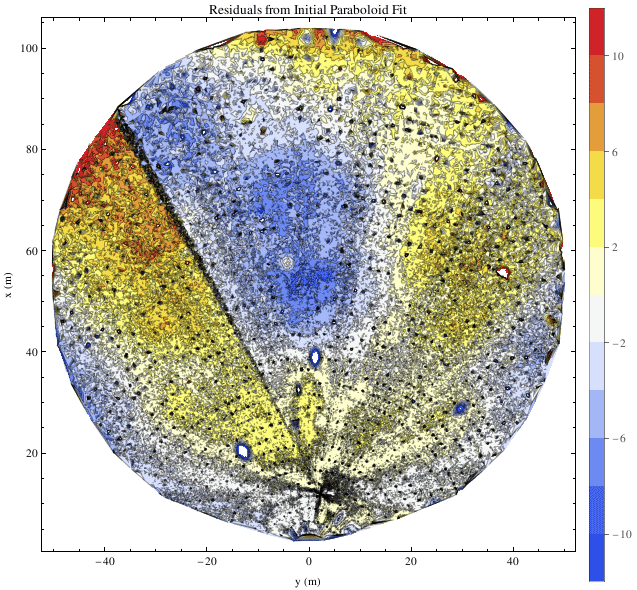
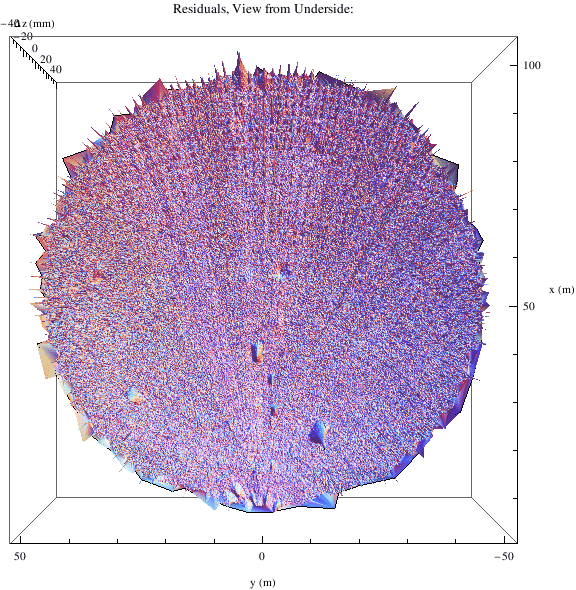
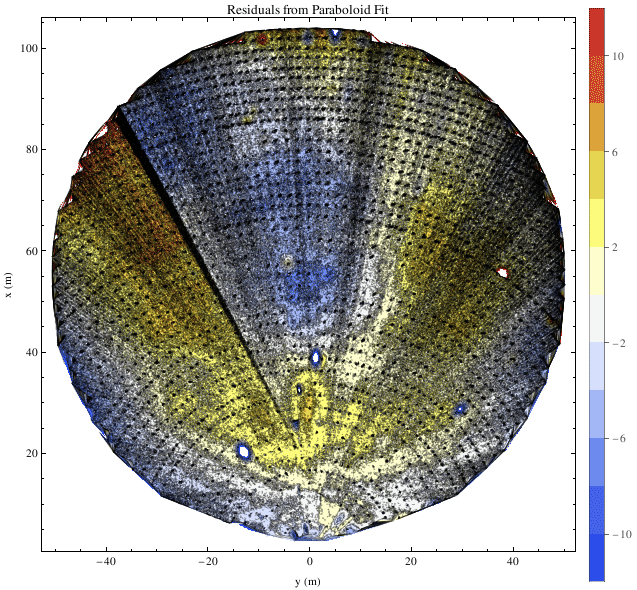
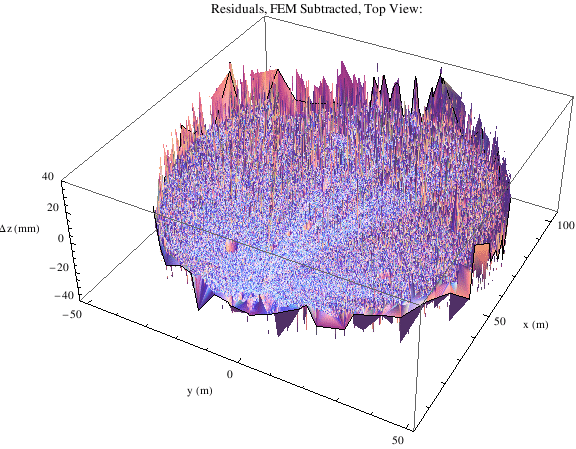
![]()
![]()
![]()
![]()
![]()
![]()
| Estimate | Standard Error | t-Statistic | P-Value | |
| x0 | 5.5929 | 0.000619016 | 9035.14 | 3.17800280.932881625443367*^-261187 |
| y0 | -10.6828 | 0.00059613 | -17920.3 | 4.07278275.932881625443367*^-320588 |
| z0 | -47.8918 | 0.000118355 | -404647. | 2.94385040.932881625443367*^-591299 |
| phi | 2.45294 | 0.0000226567 | 108266. | 2.48527696.932881625443367*^-476786 |
| theta | -0.223084 | 4.85508*10^^-6 | -45948.7 | 2.23700304.932881625443367*^-402348 |
| fl | 60.0345 | 0.000300254 | 199945. | 2.24395921.932881625443367*^-530068 |
![]()
![]()
![]()
![]()
![]()
| Estimate | Standard Error | t-Statistic | P-Value | |
| x0 | 5.5998 | 0.000342848 | 16333.2 | 4.74604811.412583916135588*^-794687 |
| y0 | -10.6618 | 0.000334671 | -31857.7 | 2.18598861.412583916135588*^-968555 |
| z0 | -47.8931 | 0.0000601241 | -796571. | 1.71167270.412583916135588*^-1807276 |
| phi | 2.45235 | 0.000011749 | 208729. | 4.84324015.412583916135588*^-1458296 |
| theta | -0.223104 | 2.62873*10^^-6 | -84871.2 | 2.55633864.412583916135588*^-1223814 |
| fl | 60.0166 | 0.000176051 | 340904. | 5.11869523.412583916135588*^-1586124 |
![]()


![]()
![]()