![]()
![]()
![]()
![]()
![]()
![]()
![]()
![]()
![]()
![]()
| Estimate | Standard Error | t-Statistic | P-Value | |
| x0 | 11.7013 | 0.000539651 | 21683.2 | 1.05777325.932881625443367*^-337134 |
| y0 | 1.82286 | 0.000634759 | 2871.74 | 1.76532105.932881625443367*^-162566 |
| z0 | -47.9548 | 0.000112271 | -427134. | 7.10828522.932881625443367*^-595997 |
| phi | 1.20196 | 0.0000224261 | 53596.3 | 2.54391696.932881625443367*^-415719 |
| theta | -0.218944 | 4.68937*10^^-6 | -46689.4 | 2.72428092.932881625443367*^-403737 |
| fl | 60.0284 | 0.000289481 | 207366. | 1.76988471.932881625443367*^-533233 |
![]()
![]()
![]()
![]()
![]()
![]()
| Estimate | Standard Error | t-Statistic | P-Value | |
| x0 | 11.6804 | 0.000306768 | 38075.6 | 1.85250049.412583916135588*^-1014991 |
| y0 | 1.83588 | 0.000341895 | 5369.71 | 1.31106225.412583916135588*^-507208 |
| z0 | -47.9568 | 0.0000565113 | -848622. | 3.42643495.412583916135588*^-1823770 |
| phi | 1.20127 | 0.0000114599 | 104824. | 4.54508472.412583916135588*^-1278831 |
| theta | -0.218882 | 2.52517*10^^-6 | -86680.1 | 2.33921163.412583916135588*^-1229309 |
| fl | 60.0224 | 0.000169215 | 354711. | 8.04871686.412583916135588*^-1596469 |
![]()
![]()
![]()
![]()
![]()
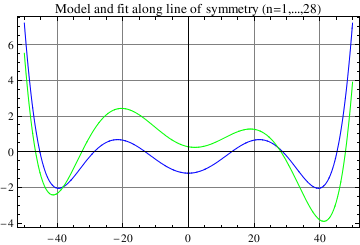
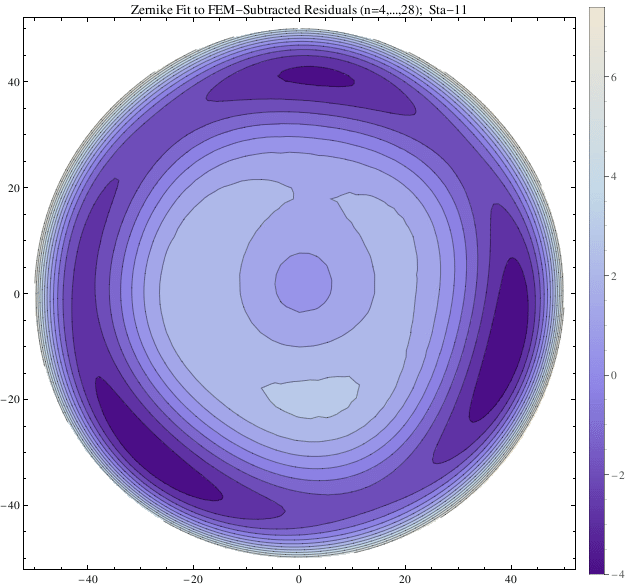
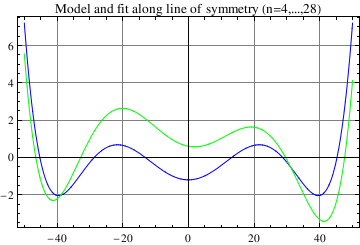
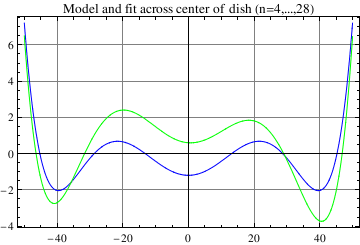
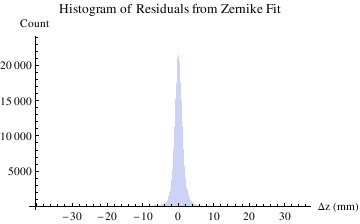
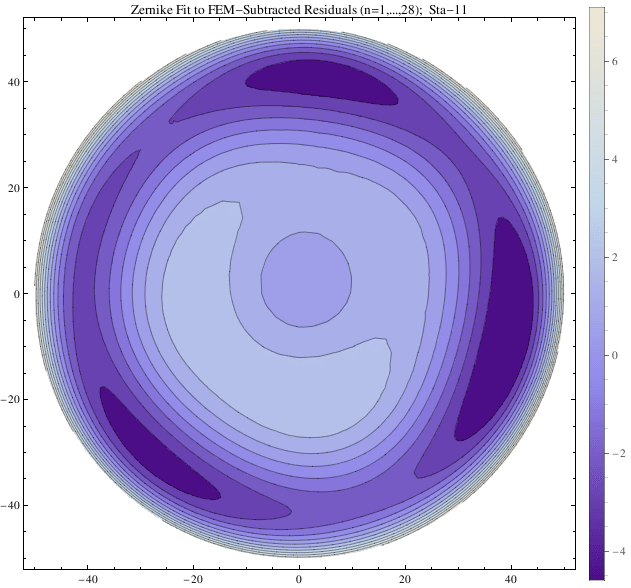
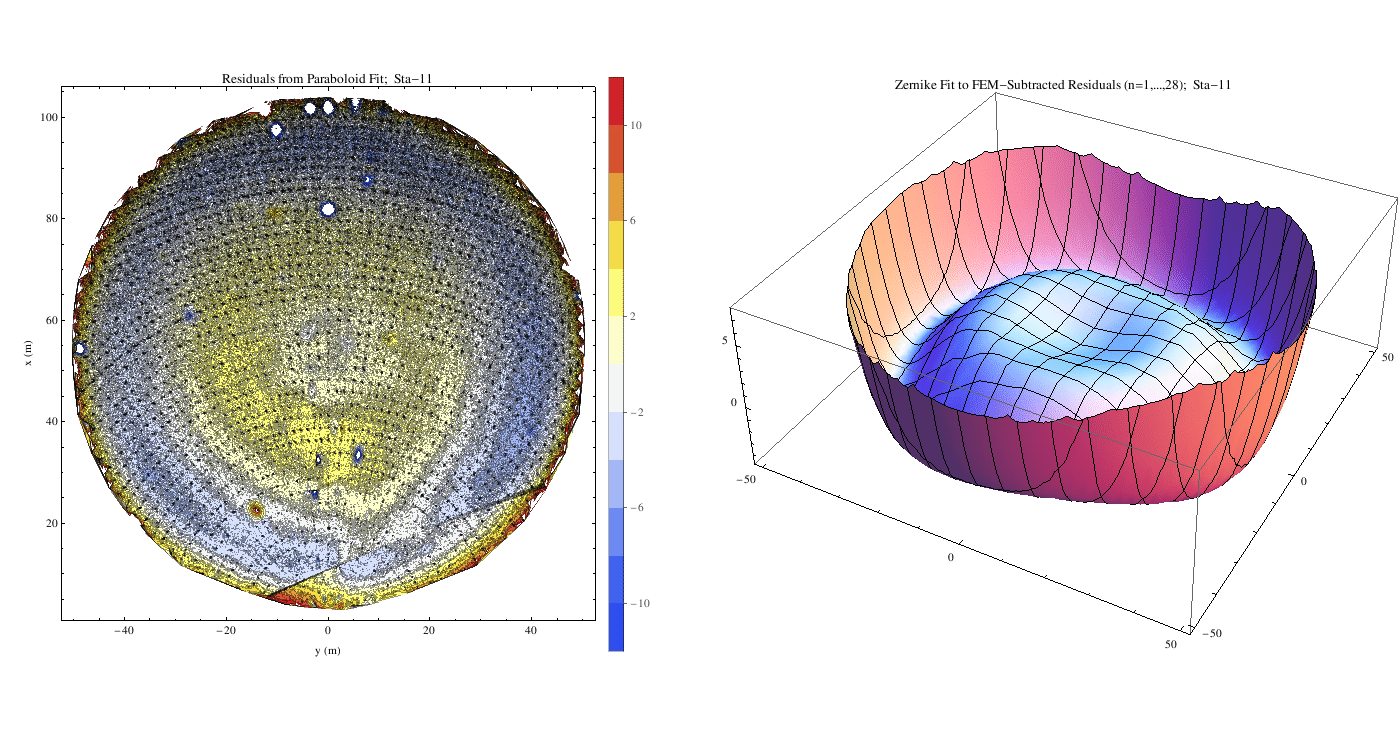
| n | coef. | σ |
| 4 | -13 | 6 |
| 5 | -924 | 5 |
| 6 | -397 | 6 |
| 7 | -513 | 7 |
| 8 | 397 | 7 |
| 9 | 357 | 7 |
| 10 | 836 | 7 |
| 11 | -358 | 8 |
| 12 | 421 | 8 |
| 13 | 3315 | 6 |
| 14 | -133 | 8 |
| 15 | 275 | 8 |
| 16 | -234 | 9 |
| 17 | 269 | 9 |
| 18 | 63 | 9 |
| 19 | -296 | 9 |
| 20 | -357 | 9 |
| 21 | -297 | 8 |
| 22 | 121 | 9 |
| 23 | -17 | 9 |
| 24 | 292 | 10 |
| 25 | 3640 | 7 |
| 26 | -61 | 9 |
| 27 | -418 | 9 |
| 28 | 20 | 9 |

![]()
![]()
![]()
![]()
![]()
![]()
![]()
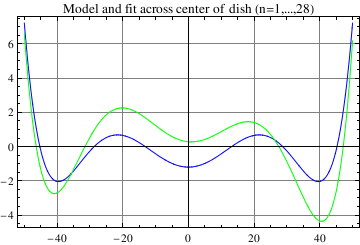
| n | coef. | σ |
| 1 | -273 | 3 |
| 2 | -335 | 5 |
| 3 | -195 | 5 |
| 4 | -11 | 6 |
| 5 | -877 | 5 |
| 6 | -382 | 6 |
| 7 | -520 | 7 |
| 8 | 460 | 7 |
| 9 | 406 | 7 |
| 10 | 834 | 7 |
| 11 | -360 | 8 |
| 12 | 427 | 8 |
| 13 | 3374 | 6 |
| 14 | -113 | 8 |
| 15 | 279 | 8 |
| 16 | -234 | 8 |
| 17 | 269 | 9 |
| 18 | 146 | 9 |
| 19 | -243 | 9 |
| 20 | -353 | 9 |
| 21 | -296 | 8 |
| 22 | 119 | 9 |
| 23 | -18 | 9 |
| 24 | 307 | 9 |
| 25 | 3698 | 7 |
| 26 | -46 | 9 |
| 27 | -409 | 9 |
| 28 | 25 | 9 |
![]()
![]()
![]()