![]()
![]()
![]()
![]()
![]()
![]()
![]()
![]()
![]()
![]()
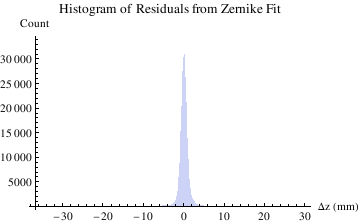
| Estimate | Standard Error | t-Statistic | P-Value | |
| x0 | 11.7052 | 0.000523165 | 22373.8 | 4.69438857.932881625443367*^-339857 |
| y0 | 1.82431 | 0.000613681 | 2972.73 | 9.46300212.932881625443367*^-165500 |
| z0 | -47.9537 | 0.000108818 | -440679. | 2.44912009.932881625443367*^-598708 |
| phi | 1.20201 | 0.0000216843 | 55432.1 | 2.73030806.932881625443367*^-418644 |
| theta | -0.218973 | 4.54565*10^^-6 | -48172. | 2.48852057.932881625443367*^-406452 |
| fl | 60.0253 | 0.000280603 | 213915. | 3.49246730.932881625443367*^-535934 |
![]()
![]()
![]()
![]()
![]()
![]()
| Estimate | Standard Error | t-Statistic | P-Value | |
| x0 | 11.6839 | 0.000291068 | 40141.5 | 3.21643743.412583916135588*^-1028754 |
| y0 | 1.8324 | 0.000326116 | 5618.86 | 5.01838577.412583916135588*^-518796 |
| z0 | -47.9561 | 0.0000536248 | -894290. | 2.85149485.412583916135588*^-1837428 |
| phi | 1.20148 | 0.0000109373 | 109851. | 1.64082914.412583916135588*^-1291035 |
| theta | -0.218889 | 2.39712*10^^-6 | -91313.4 | 3.34822035.412583916135588*^-1242877 |
| fl | 60.021 | 0.000161145 | 372465. | 3.29224659.412583916135588*^-1609195 |
![]()
![]()
![]()
![]()
![]()
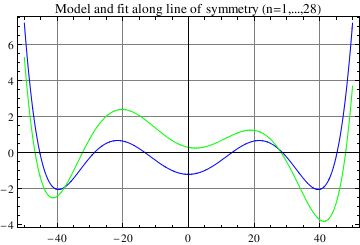
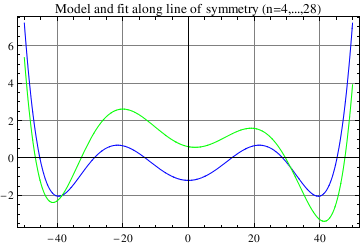
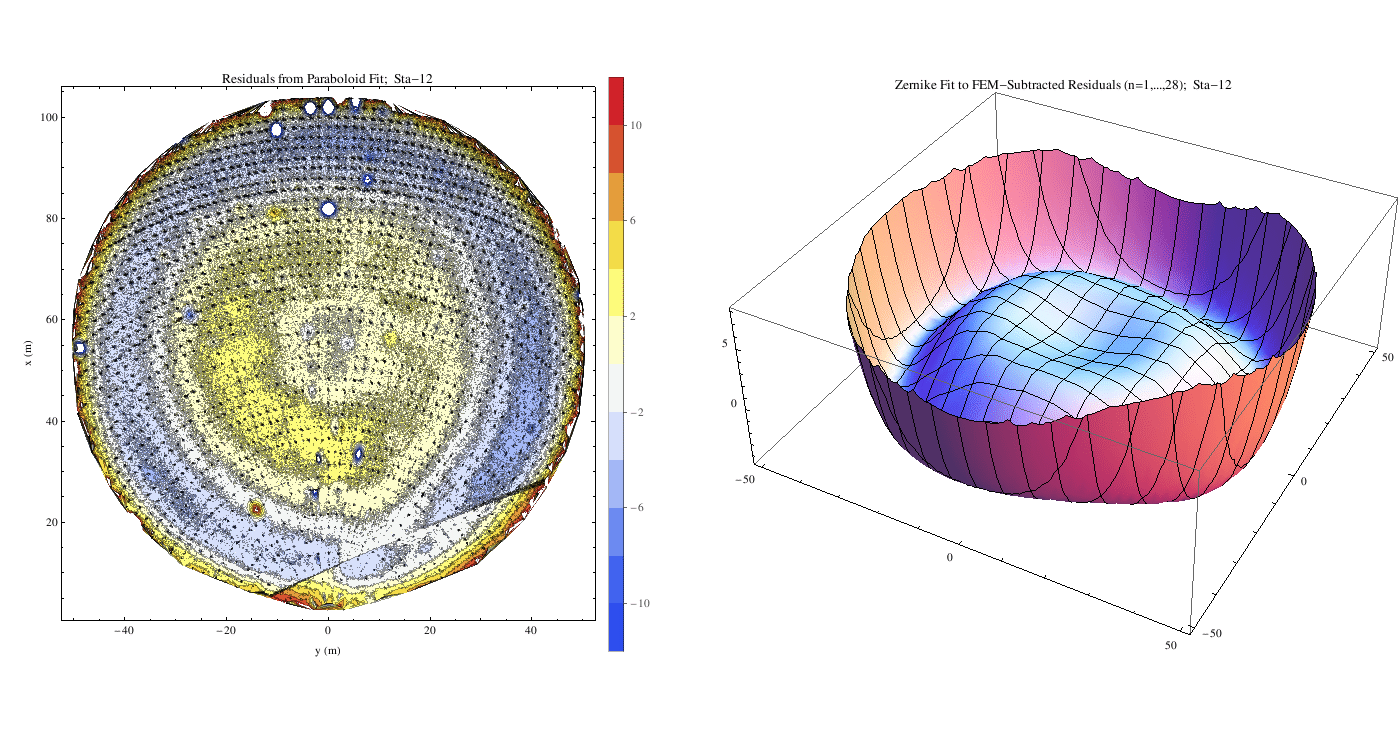
| n | coef. | σ |
| 4 | -9 | 6 |
| 5 | -893 | 4 |
| 6 | -409 | 6 |
| 7 | -432 | 6 |
| 8 | 575 | 7 |
| 9 | 293 | 7 |
| 10 | 830 | 7 |
| 11 | -448 | 7 |
| 12 | 442 | 7 |
| 13 | 3326 | 5 |
| 14 | -203 | 7 |
| 15 | 304 | 7 |
| 16 | -230 | 8 |
| 17 | 206 | 8 |
| 18 | 33 | 8 |
| 19 | -377 | 8 |
| 20 | -397 | 8 |
| 21 | -208 | 8 |
| 22 | 180 | 8 |
| 23 | -35 | 8 |
| 24 | 324 | 9 |
| 25 | 3618 | 6 |
| 26 | -50 | 8 |
| 27 | -359 | 8 |
| 28 | 109 | 8 |


![]()
![]()
![]()
![]()
![]()
![]()
![]()
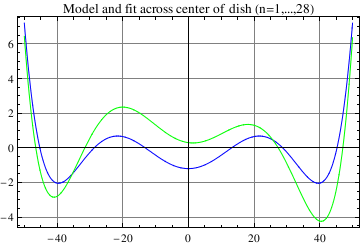
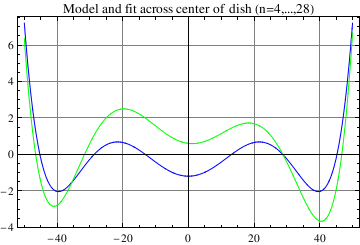
| n | coef. | σ |
| 1 | -258 | 2 |
| 2 | -306 | 5 |
| 3 | -163 | 5 |
| 4 | -7 | 6 |
| 5 | -849 | 4 |
| 6 | -395 | 6 |
| 7 | -438 | 6 |
| 8 | 633 | 7 |
| 9 | 335 | 7 |
| 10 | 827 | 6 |
| 11 | -449 | 7 |
| 12 | 444 | 7 |
| 13 | 3378 | 5 |
| 14 | -187 | 7 |
| 15 | 307 | 7 |
| 16 | -231 | 8 |
| 17 | 202 | 8 |
| 18 | 102 | 8 |
| 19 | -331 | 8 |
| 20 | -396 | 8 |
| 21 | -207 | 7 |
| 22 | 181 | 8 |
| 23 | -41 | 8 |
| 24 | 334 | 8 |
| 25 | 3669 | 6 |
| 26 | -37 | 8 |
| 27 | -354 | 8 |
| 28 | 108 | 8 |
![]()
![]()
![]()