![]()
![]()
![]()
![]()
![]()
![]()
![]()
![]()
![]()


| Estimate | Standard Error | t-Statistic | P-Value | |
| x0 | 11.692 | 0.000322603 | 36242.8 | 3.55950560.932881625443367*^-381741 |
| y0 | 1.81462 | 0.000379023 | 4787.63 | 4.42944349.932881625443367*^-206297 |
| z0 | -47.9585 | 0.0000670514 | -715250. | 3.74053365.932881625443367*^-640774 |
| phi | 1.20216 | 0.0000134016 | 89702.6 | 4.52213850.932881625443367*^-460450 |
| theta | -0.218704 | 2.8028*10^^-6 | -78030.4 | 1.59614343.932881625443367*^-448342 |
| fl | 60.0566 | 0.000173096 | 346955. | 3.57805769.932881625443367*^-577939 |
![]()
![]()
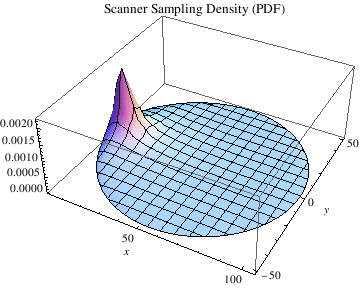
![]()
![]()

![]()
![]()
| Estimate | Standard Error | t-Statistic | P-Value | |
| x0 | 11.695 | 0.000184747 | 63302.6 | 1.64218046.412583916135588*^-1147420 |
| y0 | 1.82853 | 0.000205759 | 8886.74 | 8.64832556.412583916135588*^-636785 |
| z0 | -47.9569 | 0.0000339355 | -1.41318*10^^6 | 3.19794634.412583916135588*^-1956658 |
| phi | 1.20175 | 6.91377*10^^-6 | 173820. | 2.52814182.412583916135588*^-1410608 |
| theta | -0.218781 | 1.51512*10^^-6 | -144399. | 8.65704282.412583916135588*^-1362288 |
| fl | 60.0515 | 0.000101444 | 591969. | 4.38648818.412583916135588*^-1729922 |
![]()
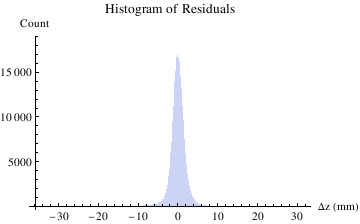
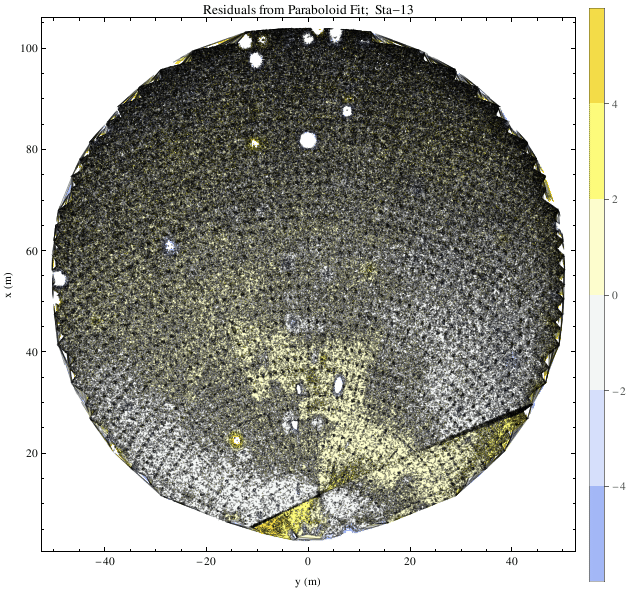
![]()
![]()
![]()
![]()
| n | coef. | σ |
| 4 | -62 | 6 |
| 5 | -52 | 4 |
| 6 | -145 | 6 |
| 7 | -458 | 6 |
| 8 | 586 | 7 |
| 9 | 72 | 7 |
| 10 | 337 | 7 |
| 11 | -37 | 7 |
| 12 | 305 | 7 |
| 13 | 86 | 5 |
| 14 | -174 | 7 |
| 15 | 300 | 7 |
| 16 | -351 | 8 |
| 17 | 412 | 8 |
| 18 | 123 | 8 |
| 19 | -348 | 8 |
| 20 | -506 | 8 |
| 21 | 68 | 7 |
| 22 | 35 | 8 |
| 23 | 140 | 8 |
| 24 | -40 | 9 |
| 25 | 132 | 6 |
| 26 | -104 | 8 |
| 27 | -339 | 8 |
| 28 | 61 | 8 |
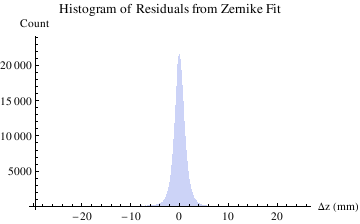
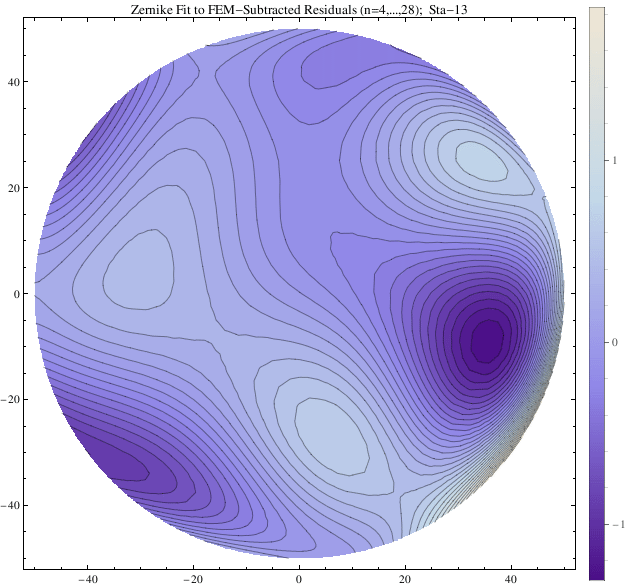
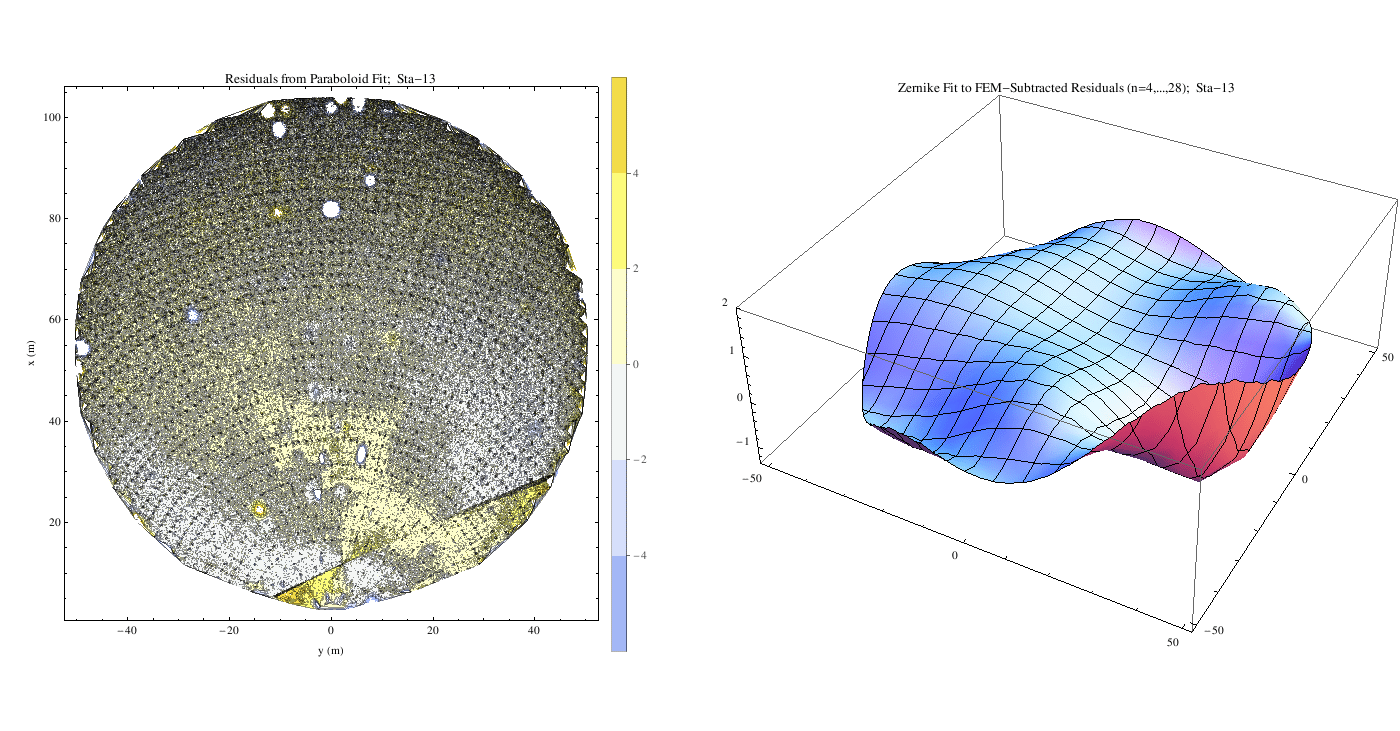
![]()
![]()
![]()
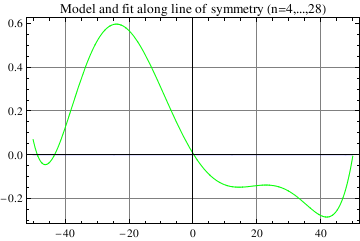
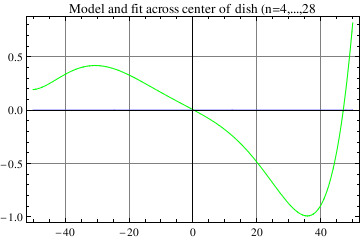
![]()
![]()
![]()
![]()
| n | coef. | σ |
| 1 | -14 | 2 |
| 2 | -75 | 5 |
| 3 | 37 | 5 |
| 4 | -58 | 6 |
| 5 | -50 | 4 |
| 6 | -145 | 6 |
| 7 | -460 | 6 |
| 8 | 598 | 7 |
| 9 | 68 | 7 |
| 10 | 337 | 7 |
| 11 | -38 | 7 |
| 12 | 309 | 7 |
| 13 | 89 | 5 |
| 14 | -172 | 7 |
| 15 | 301 | 7 |
| 16 | -350 | 8 |
| 17 | 412 | 8 |
| 18 | 137 | 8 |
| 19 | -353 | 8 |
| 20 | -507 | 8 |
| 21 | 69 | 7 |
| 22 | 35 | 8 |
| 23 | 139 | 8 |
| 24 | -35 | 9 |
| 25 | 136 | 6 |
| 26 | -102 | 8 |
| 27 | -337 | 8 |
| 28 | 61 | 8 |
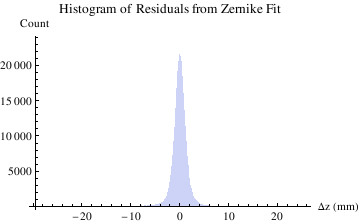
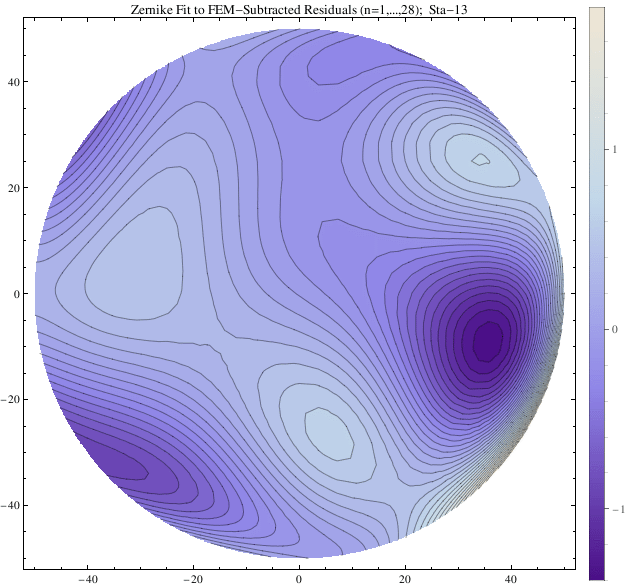
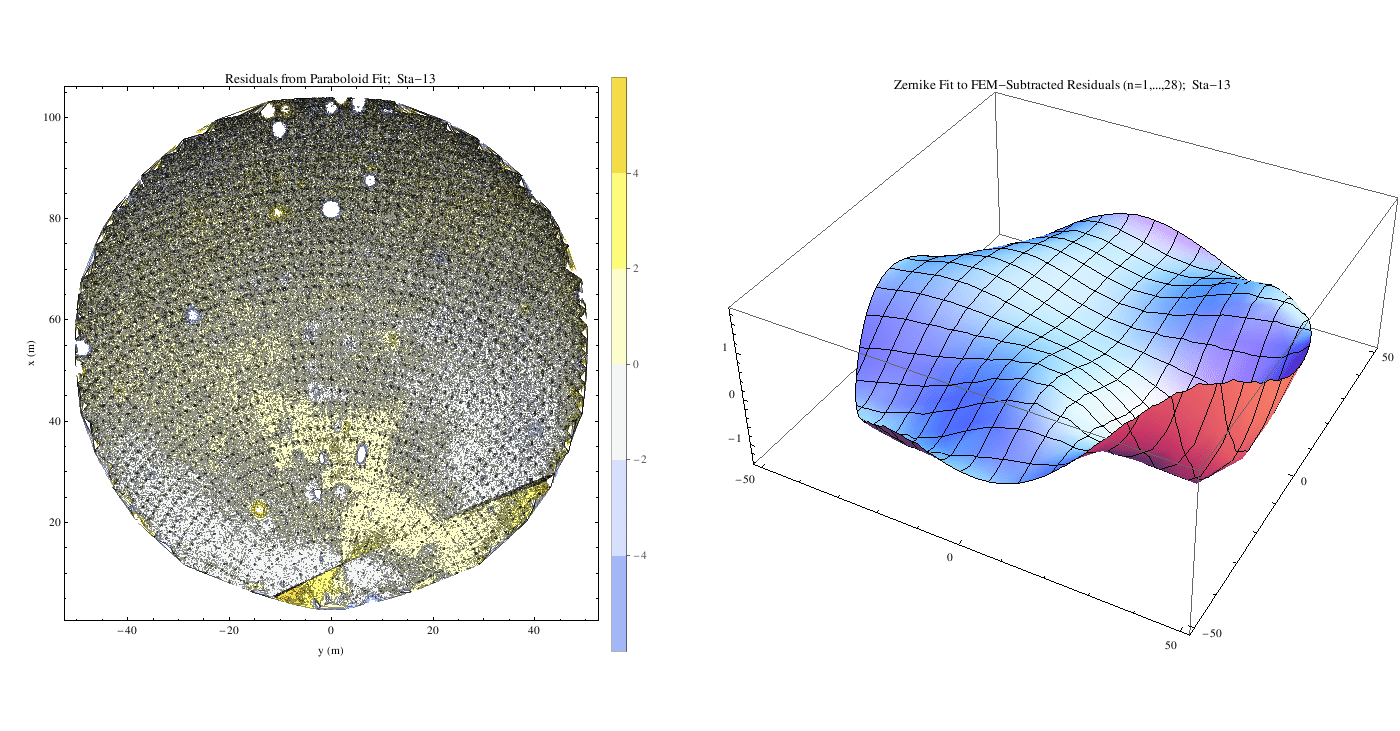
![]()
![]()
![]()
