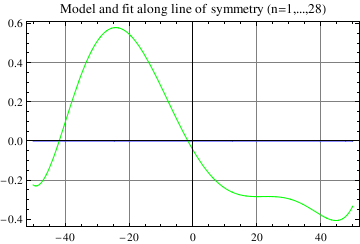
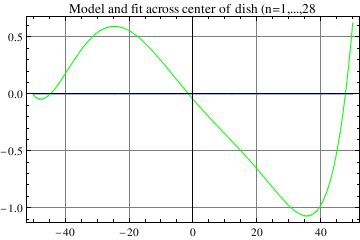
![]()
![]()
![]()
![]()
![]()
![]()
![]()
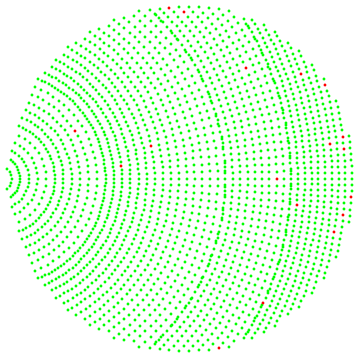
![]()
![]()
![]()
| Estimate | Standard Error | t-Statistic | P-Value | |
| x0 | 11.7019 | 0.000289499 | 40421.2 | 3.14653109.932881625443367*^-391217 |
| y0 | 1.81244 | 0.000340332 | 5325.49 | 1.80110881.932881625443367*^-215472 |
| z0 | -47.9564 | 0.0000601908 | -796740. | 1.26509786.932881625443367*^-650145 |
| phi | 1.20241 | 0.0000120303 | 99948.9 | 3.66408653.932881625443367*^-469844 |
| theta | -0.218789 | 2.51558*10^^-6 | -86973.6 | 1.22463014.932881625443367*^-457766 |
| fl | 60.052 | 0.000155392 | 386454. | 7.95504981.932881625443367*^-587304 |
![]()
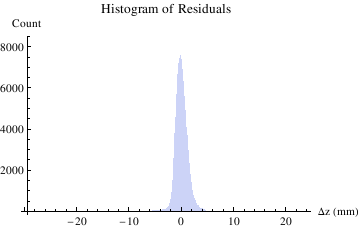
![]()
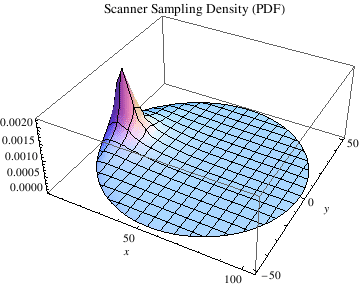
![]()
![]()
![]()
![]()
![]()
| Estimate | Standard Error | t-Statistic | P-Value | |
| x0 | 11.7057 | 0.000162021 | 72248.1 | 1.09236870.412583916135588*^-1181858 |
| y0 | 1.82374 | 0.0001802 | 10120.6 | 6.37558766.412583916135588*^-670439 |
| z0 | -47.9548 | 0.0000298009 | -1.60917*10^^6 | 7.17108420.412583916135588*^-1990501 |
| phi | 1.2021 | 6.04843*10^^-6 | 198746. | 8.77669796.412583916135588*^-1445526 |
| theta | -0.218866 | 1.33032*10^^-6 | -164522. | 1.48552554.412583916135588*^-1396282 |
| fl | 60.0468 | 0.0000891793 | 673327. | 6.97007972.412583916135588*^-1763478 |
![]()
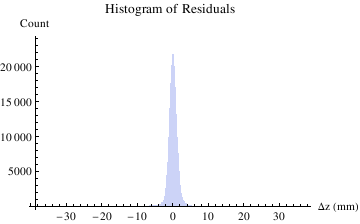
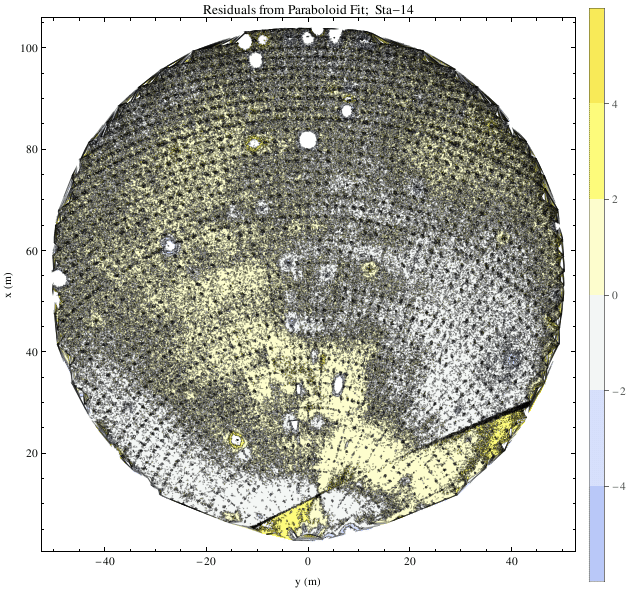
![]()
![]()
![]()
![]()
| n | coef. | σ |
| 4 | -77 | 5 |
| 5 | -56 | 4 |
| 6 | -187 | 5 |
| 7 | -300 | 6 |
| 8 | 820 | 6 |
| 9 | 114 | 6 |
| 10 | 449 | 6 |
| 11 | -251 | 6 |
| 12 | 268 | 6 |
| 13 | 45 | 4 |
| 14 | -244 | 6 |
| 15 | 397 | 6 |
| 16 | -470 | 7 |
| 17 | 300 | 7 |
| 18 | 26 | 7 |
| 19 | -400 | 7 |
| 20 | -588 | 7 |
| 21 | 59 | 6 |
| 22 | 46 | 7 |
| 23 | 152 | 7 |
| 24 | 41 | 7 |
| 25 | 129 | 5 |
| 26 | -138 | 7 |
| 27 | -333 | 7 |
| 28 | 13 | 7 |
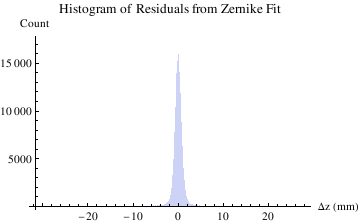
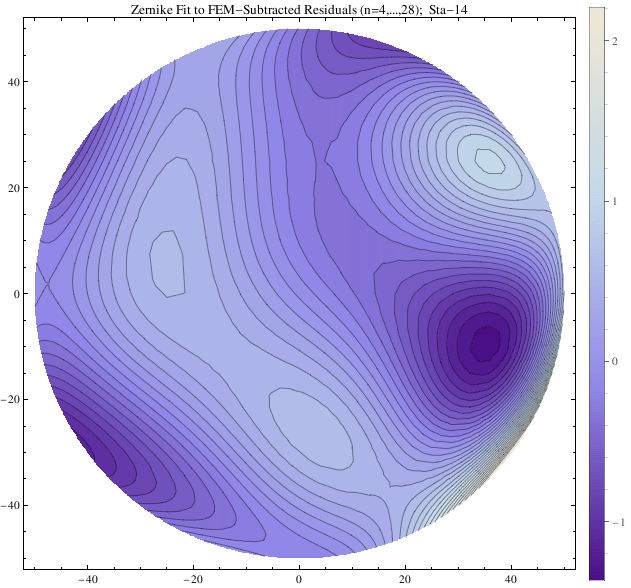
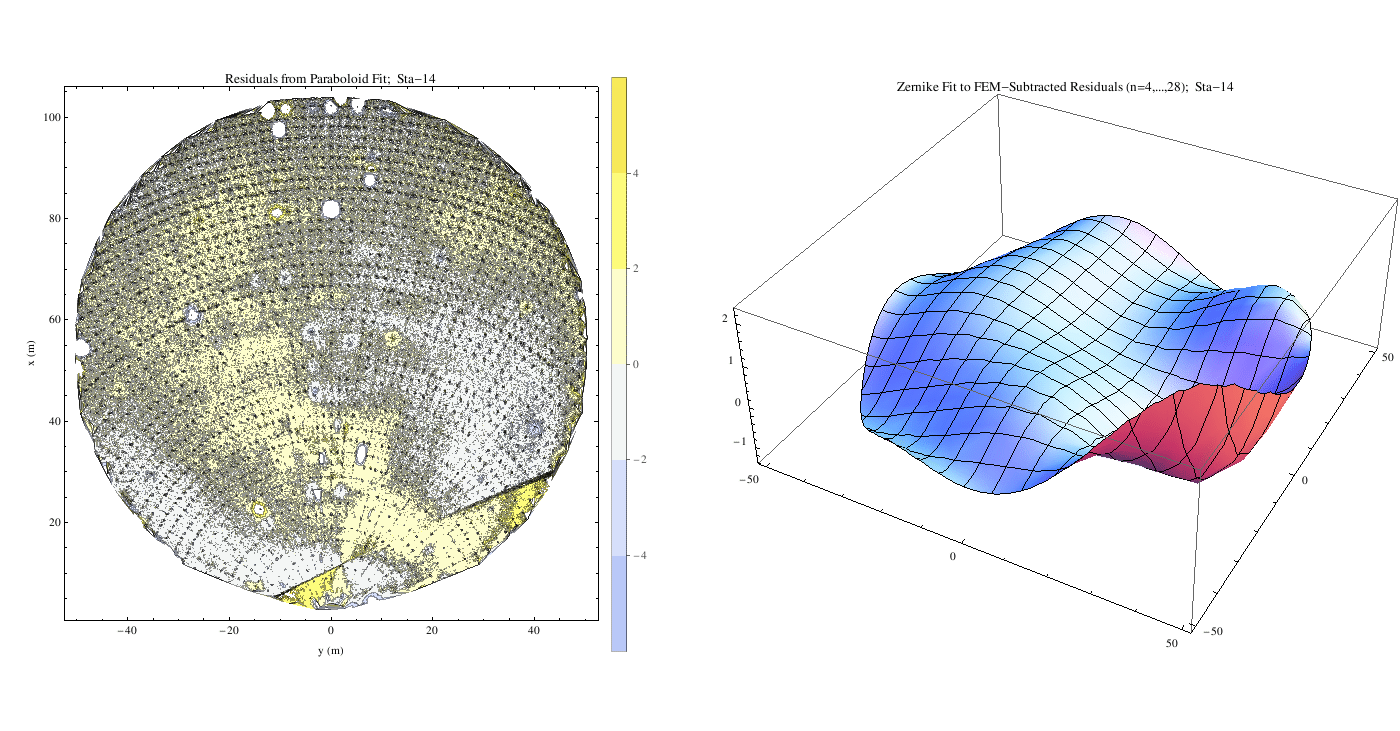
![]()
![]()
![]()
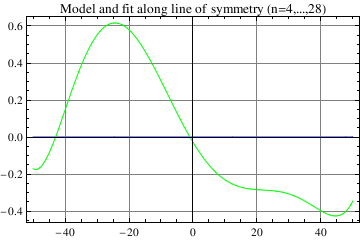
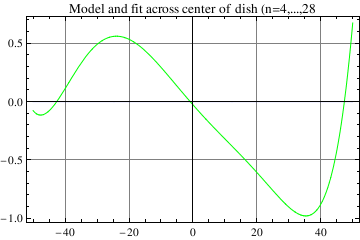
![]()
![]()
![]()
![]()
| n | coef. | σ |
| 1 | -15 | 2 |
| 2 | -90 | 4 |
| 3 | 41 | 4 |
| 4 | -72 | 5 |
| 5 | -53 | 4 |
| 6 | -187 | 5 |
| 7 | -302 | 6 |
| 8 | 834 | 6 |
| 9 | 110 | 6 |
| 10 | 449 | 6 |
| 11 | -252 | 6 |
| 12 | 273 | 6 |
| 13 | 49 | 4 |
| 14 | -242 | 6 |
| 15 | 399 | 6 |
| 16 | -469 | 7 |
| 17 | 299 | 7 |
| 18 | 42 | 7 |
| 19 | -405 | 7 |
| 20 | -589 | 7 |
| 21 | 60 | 6 |
| 22 | 47 | 7 |
| 23 | 152 | 7 |
| 24 | 46 | 7 |
| 25 | 133 | 5 |
| 26 | -136 | 7 |
| 27 | -331 | 7 |
| 28 | 14 | 7 |
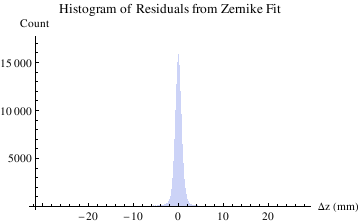
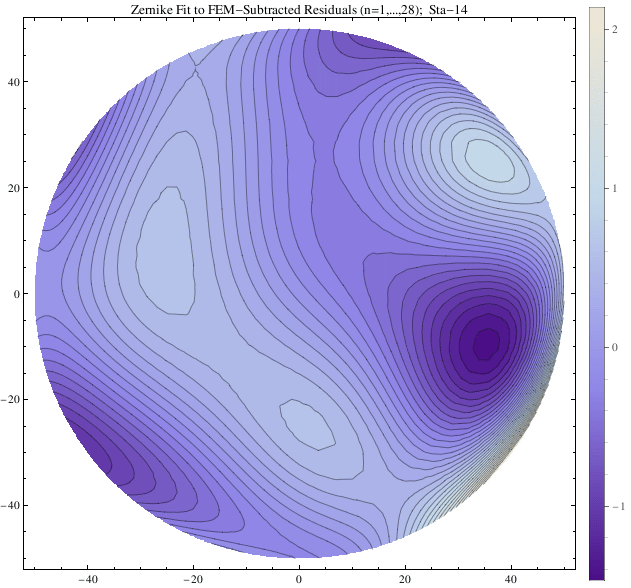
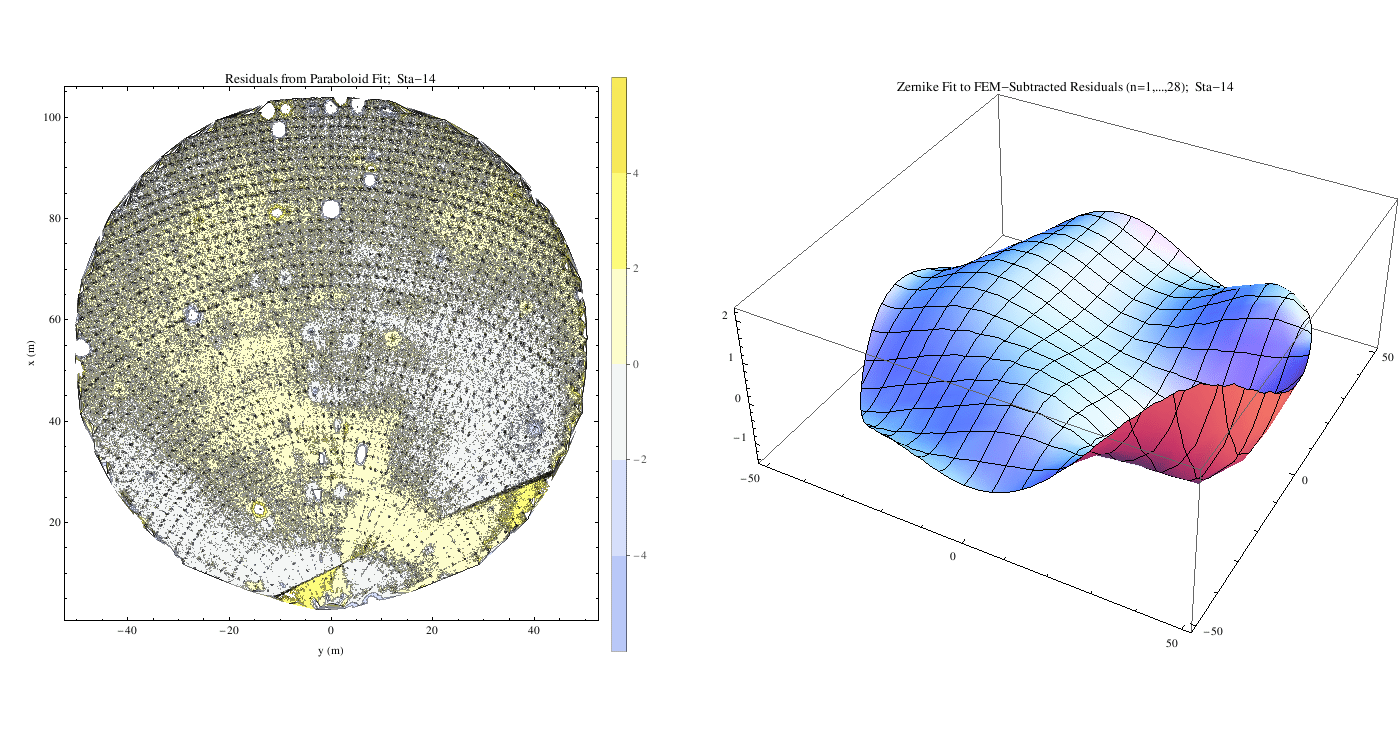
![]()
![]()
![]()
