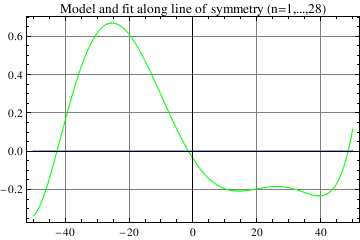
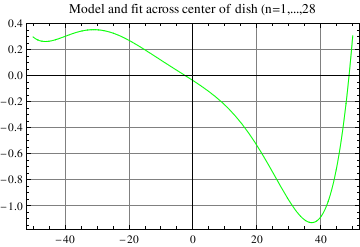
![]()
![]()
![]()
![]()
![]()
![]()
![]()
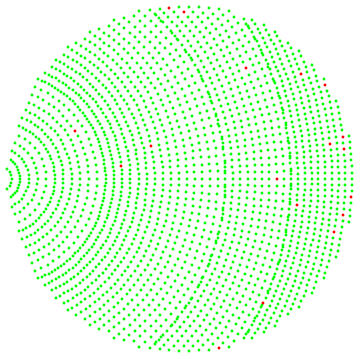
![]()
![]()
![]()
| Estimate | Standard Error | t-Statistic | P-Value | |
| x0 | 11.7026 | 0.000293557 | 39864.8 | 2.18581233.932881625443367*^-390013 |
| y0 | 1.81558 | 0.000345238 | 5258.91 | 1.70449262.932881625443367*^-214387 |
| z0 | -47.9561 | 0.0000610349 | -785716. | 1.81004183.932881625443367*^-648935 |
| phi | 1.20233 | 0.0000122013 | 98540.9 | 6.98398736.932881625443367*^-468612 |
| theta | -0.218784 | 2.55094*10^^-6 | -85765.8 | 4.56796330.932881625443367*^-456552 |
| fl | 60.0549 | 0.00015765 | 380937. | 6.64207984.932881625443367*^-586055 |
![]()
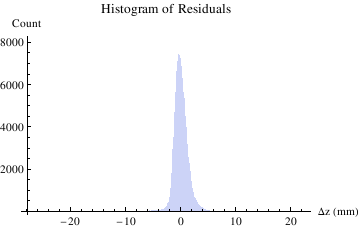
![]()
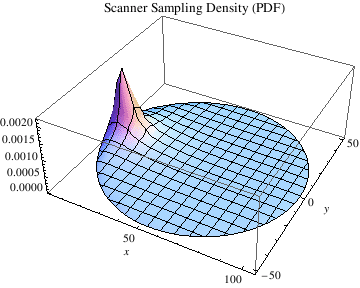
![]()
![]()
![]()
![]()
| Estimate | Standard Error | t-Statistic | P-Value | |
| x0 | 11.7056 | 0.000160285 | 73029.8 | 1.45590064.412583916135588*^-1184662 |
| y0 | 1.82787 | 0.000179472 | 10184.7 | 9.96461087.412583916135588*^-672074 |
| z0 | -47.9546 | 0.0000294999 | -1.62558*10^^6 | 2.96945280.412583916135588*^-1993145 |
| phi | 1.20198 | 6.02359*10^^-6 | 199545. | 5.26816726.412583916135588*^-1446572 |
| theta | -0.21886 | 1.3175*10^^-6 | -166118. | 9.57407431.412583916135588*^-1398799 |
| fl | 60.0492 | 0.0000885181 | 678383. | 4.13180705.412583916135588*^-1765427 |
![]()
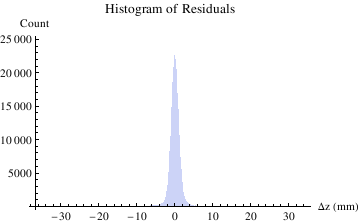
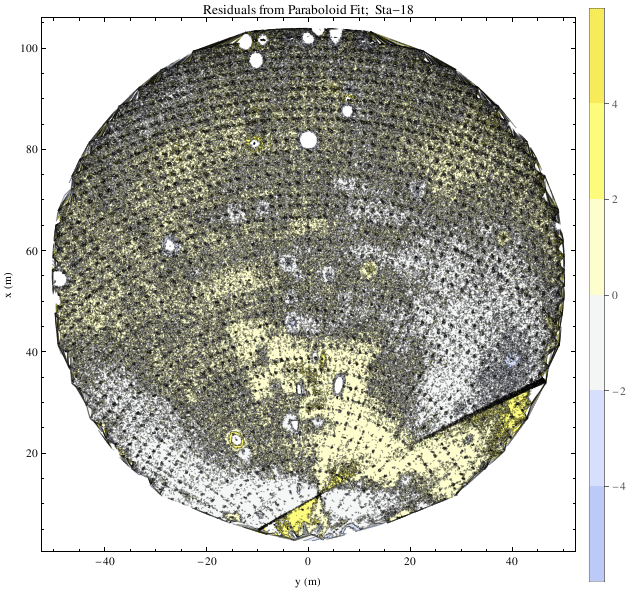
![]()
![]()
![]()
![]()
| n | coef. | σ |
| 4 | -42 | 5 |
| 5 | -46 | 4 |
| 6 | -132 | 5 |
| 7 | -416 | 6 |
| 8 | 548 | 6 |
| 9 | 171 | 6 |
| 10 | 270 | 6 |
| 11 | -154 | 6 |
| 12 | 412 | 6 |
| 13 | 49 | 4 |
| 14 | -166 | 6 |
| 15 | 371 | 6 |
| 16 | -553 | 7 |
| 17 | 355 | 7 |
| 18 | 118 | 7 |
| 19 | -327 | 7 |
| 20 | -588 | 7 |
| 21 | 39 | 6 |
| 22 | -162 | 7 |
| 23 | 133 | 7 |
| 24 | -15 | 7 |
| 25 | 117 | 5 |
| 26 | -116 | 7 |
| 27 | -433 | 7 |
| 28 | 44 | 7 |
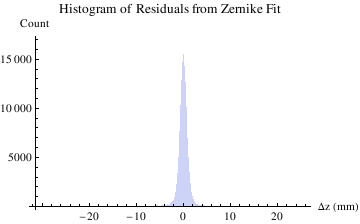
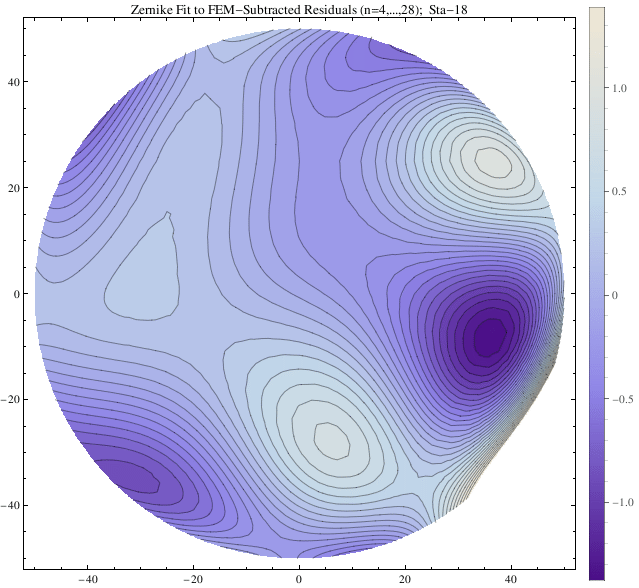
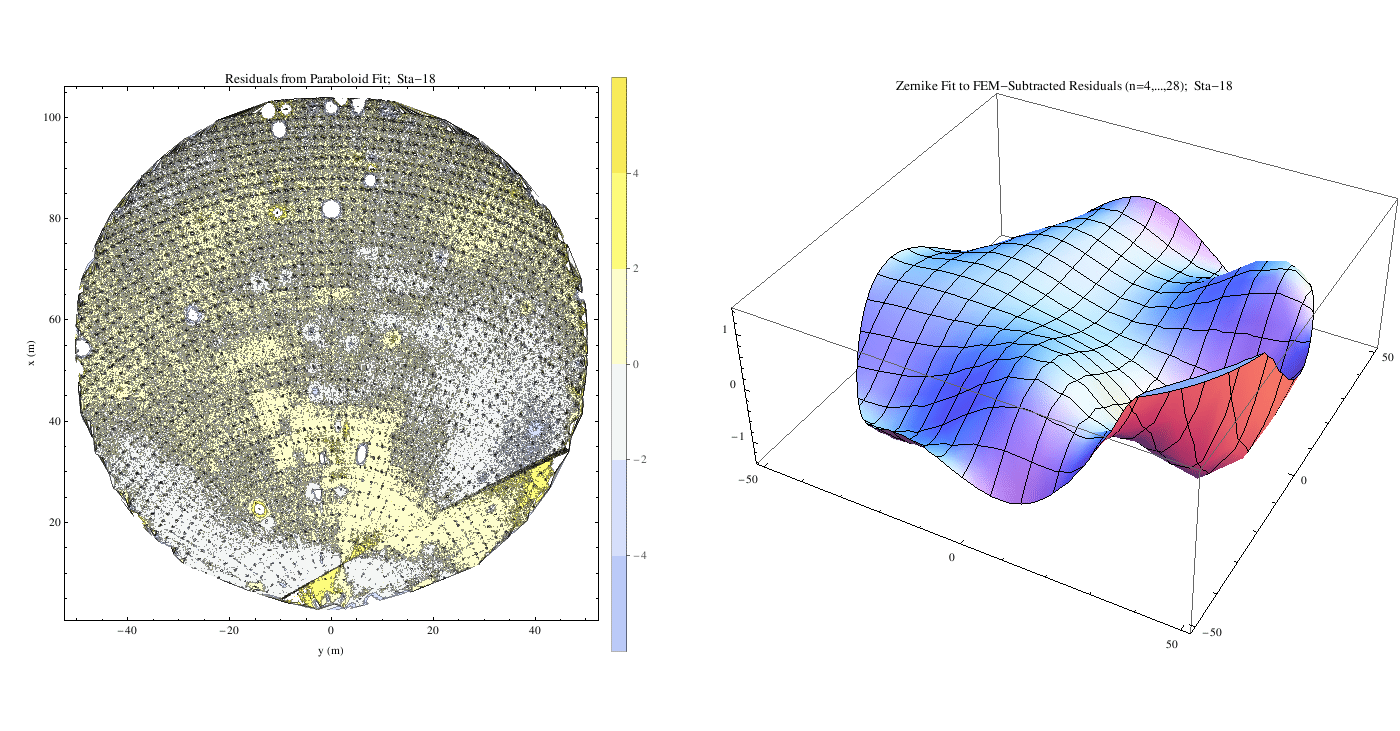
![]()
![]()
![]()
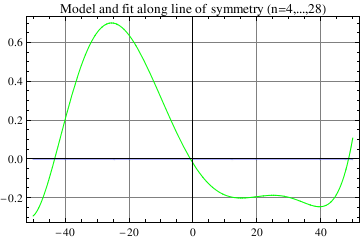
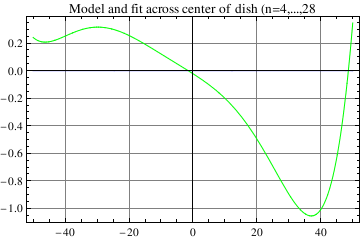
![]()
![]()
![]()
![]()
| n | coef. | σ |
| 1 | -13 | 2 |
| 2 | -71 | 4 |
| 3 | 32 | 4 |
| 4 | -38 | 5 |
| 5 | -43 | 4 |
| 6 | -132 | 5 |
| 7 | -418 | 6 |
| 8 | 560 | 6 |
| 9 | 167 | 6 |
| 10 | 270 | 6 |
| 11 | -154 | 6 |
| 12 | 416 | 6 |
| 13 | 52 | 4 |
| 14 | -164 | 6 |
| 15 | 372 | 6 |
| 16 | -552 | 7 |
| 17 | 355 | 7 |
| 18 | 131 | 7 |
| 19 | -332 | 7 |
| 20 | -590 | 7 |
| 21 | 40 | 6 |
| 22 | -160 | 7 |
| 23 | 132 | 7 |
| 24 | -12 | 7 |
| 25 | 120 | 5 |
| 26 | -115 | 7 |
| 27 | -433 | 7 |
| 28 | 44 | 7 |
![]()
![]()
![]()
