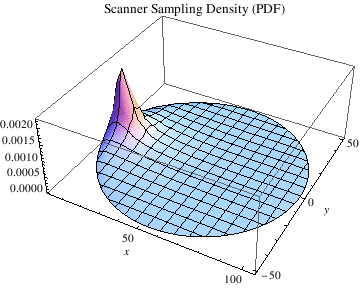
![]()
![]()
![]()
![]()
![]()
![]()
![]()
![]()
![]()
![]()
| Estimate | Standard Error | t-Statistic | P-Value | |
| x0 | 11.6764 | 0.00035401 | 32983.1 | 6.89676309.932881625443367*^-373557 |
| y0 | 1.81002 | 0.000415291 | 4358.45 | 4.40981487.932881625443367*^-198217 |
| z0 | -47.961 | 0.0000735403 | -652173. | 2.11144776.932881625443367*^-632755 |
| phi | 1.20205 | 0.0000146958 | 81795.7 | 1.22585954.932881625443367*^-452435 |
| theta | -0.218572 | 3.07598*10^^-6 | -71057.5 | 2.49911523.932881625443367*^-440212 |
| fl | 60.0597 | 0.000189932 | 316217. | 8.49757582.932881625443367*^-569882 |
![]()
![]()
![]()
![]()
![]()
![]()
| Estimate | Standard Error | t-Statistic | P-Value | |
| x0 | 11.6911 | 0.000186652 | 62635.7 | 2.54744205.412583916135588*^-1144661 |
| y0 | 1.8246 | 0.000208709 | 8742.31 | 7.24650161.412583916135588*^-632548 |
| z0 | -47.9573 | 0.0000343578 | -1.39582*10^^6 | 3.80252232.412583916135588*^-1953438 |
| phi | 1.20177 | 7.00067*10^^-6 | 171665. | 1.19714045.412583916135588*^-1407357 |
| theta | -0.218737 | 1.5349*10^^-6 | -142509. | 7.89049862.412583916135588*^-1358856 |
| fl | 60.0513 | 0.000103016 | 582935. | 1.52774695.412583916135588*^-1725914 |
![]()
![]()
![]()
![]()
![]()
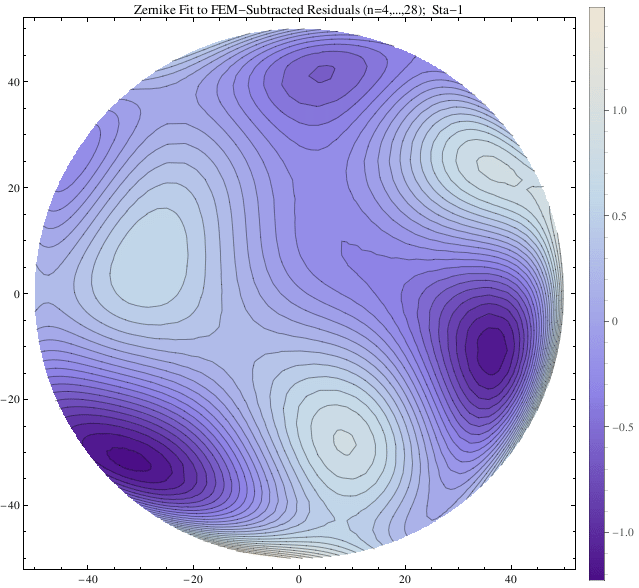
| n | coef. | σ |
| 4 | -47 | 6 |
| 5 | -53 | 4 |
| 6 | -151 | 6 |
| 7 | -307 | 7 |
| 8 | 472 | 7 |
| 9 | 142 | 7 |
| 10 | 726 | 7 |
| 11 | 219 | 7 |
| 12 | 88 | 7 |
| 13 | 104 | 5 |
| 14 | 71 | 7 |
| 15 | 320 | 7 |
| 16 | -314 | 8 |
| 17 | 574 | 8 |
| 18 | -4 | 8 |
| 19 | -332 | 8 |
| 20 | -442 | 8 |
| 21 | -123 | 8 |
| 22 | 13 | 8 |
| 23 | 194 | 8 |
| 24 | -86 | 9 |
| 25 | 232 | 6 |
| 26 | -119 | 8 |
| 27 | -372 | 9 |
| 28 | 74 | 8 |


![]()
![]()
![]()
![]()
![]()
![]()
![]()
| n | coef. | σ |
| 1 | -15 | 2 |
| 2 | -61 | 5 |
| 3 | 6 | 5 |
| 4 | -45 | 6 |
| 5 | -50 | 4 |
| 6 | -150 | 6 |
| 7 | -308 | 7 |
| 8 | 482 | 7 |
| 9 | 142 | 7 |
| 10 | 725 | 7 |
| 11 | 219 | 7 |
| 12 | 90 | 7 |
| 13 | 108 | 5 |
| 14 | 73 | 7 |
| 15 | 321 | 7 |
| 16 | -314 | 8 |
| 17 | 574 | 8 |
| 18 | 8 | 8 |
| 19 | -332 | 8 |
| 20 | -442 | 8 |
| 21 | -123 | 8 |
| 22 | 14 | 8 |
| 23 | 193 | 8 |
| 24 | -83 | 9 |
| 25 | 236 | 6 |
| 26 | -118 | 8 |
| 27 | -372 | 9 |
| 28 | 75 | 8 |
![]()
![]()
![]()