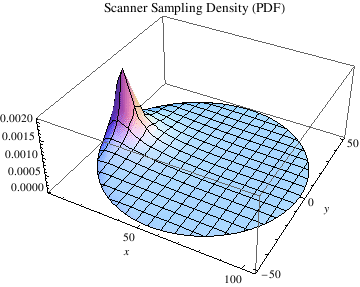
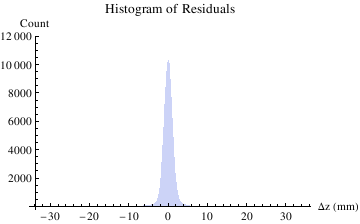
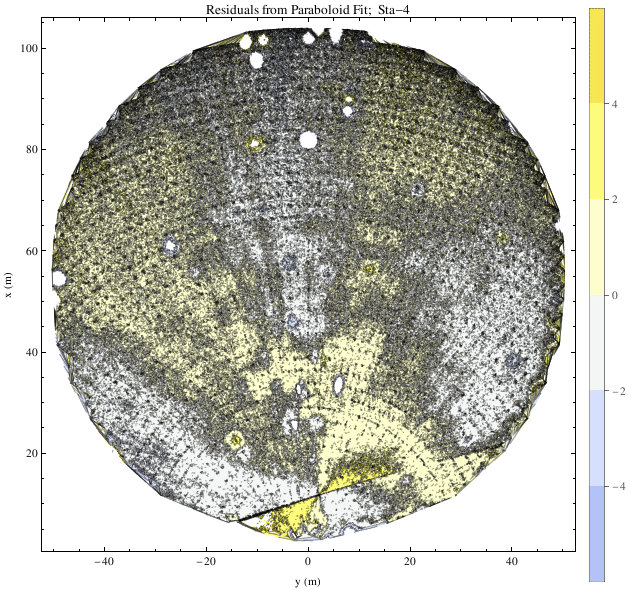
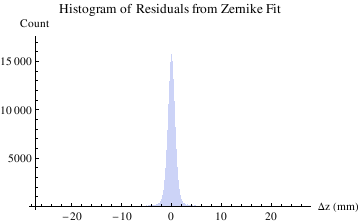
![]()
![]()
![]()
![]()
![]()
![]()
![]()
![]()
![]()
![]()
| Estimate | Standard Error | t-Statistic | P-Value | |
| x0 | 11.6967 | 0.000288219 | 40582.7 | 1.51846660.932881625443367*^-391563 |
| y0 | 1.83638 | 0.000337394 | 5442.84 | 1.24910664.932881625443367*^-217352 |
| z0 | -47.9549 | 0.0000598954 | -800644. | 3.30146002.932881625443367*^-650570 |
| phi | 1.2013 | 0.0000119298 | 100697. | 4.65459137.932881625443367*^-470492 |
| theta | -0.21881 | 2.50294*10^^-6 | -87421.1 | 1.89787424.932881625443367*^-458212 |
| fl | 60.0419 | 0.000154238 | 389281. | 9.70783915.932881625443367*^-587937 |
![]()
![]()
![]()
![]()
![]()
![]()
| Estimate | Standard Error | t-Statistic | P-Value | |
| x0 | 11.7049 | 0.000144914 | 80771.3 | 1.32716179.412583916135588*^-1210913 |
| y0 | 1.85472 | 0.000162381 | 11422. | 1.81227539.412583916135588*^-701795 |
| z0 | -47.952 | 0.0000267251 | -1.79427*10^^6 | 1.17248115.412583916135588*^-2018871 |
| phi | 1.20083 | 5.43781*10^^-6 | 220829. | 1.60581804.412583916135588*^-1472980 |
| theta | -0.218947 | 1.19403*10^^-6 | -183369. | 3.21823115.412583916135588*^-1424543 |
| fl | 60.0332 | 0.0000801247 | 749247. | 8.27818372.412583916135588*^-1791317 |
![]()
![]()
![]()
![]()
![]()
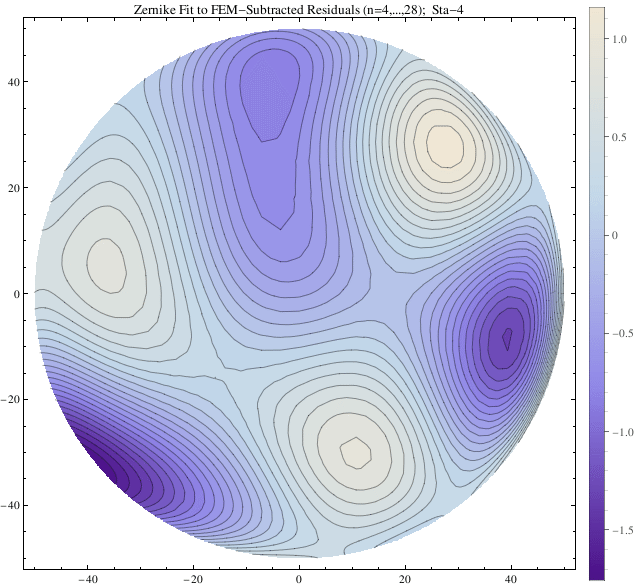
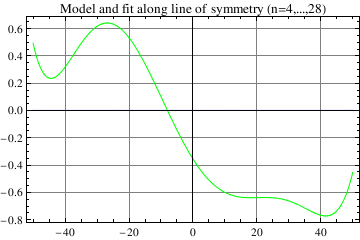
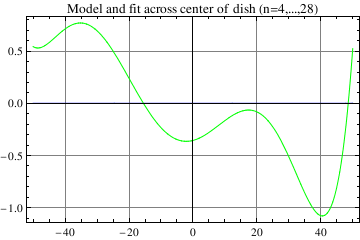
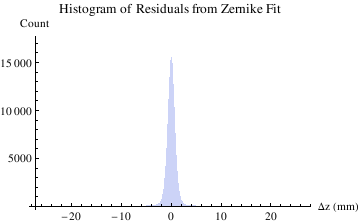
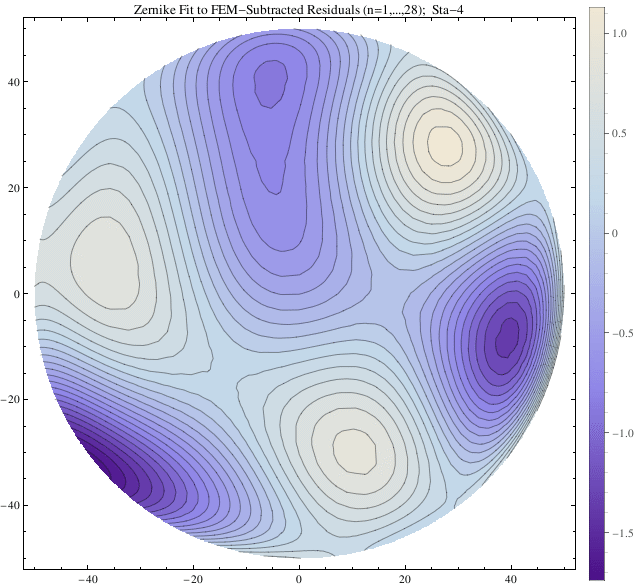
| n | coef. | σ |
| 4 | 55 | 4 |
| 5 | -29 | 3 |
| 6 | -78 | 4 |
| 7 | -890 | 5 |
| 8 | 155 | 5 |
| 9 | 430 | 5 |
| 10 | 829 | 5 |
| 11 | -69 | 5 |
| 12 | -9 | 6 |
| 13 | -151 | 4 |
| 14 | -294 | 6 |
| 15 | 16 | 5 |
| 16 | -161 | 6 |
| 17 | 651 | 6 |
| 18 | 235 | 6 |
| 19 | -333 | 6 |
| 20 | -449 | 6 |
| 21 | -191 | 6 |
| 22 | 106 | 6 |
| 23 | 293 | 6 |
| 24 | 105 | 6 |
| 25 | 234 | 5 |
| 26 | -3 | 6 |
| 27 | -261 | 6 |
| 28 | 108 | 6 |

![]()
![]()
![]()
![]()
![]()
![]()
![]()
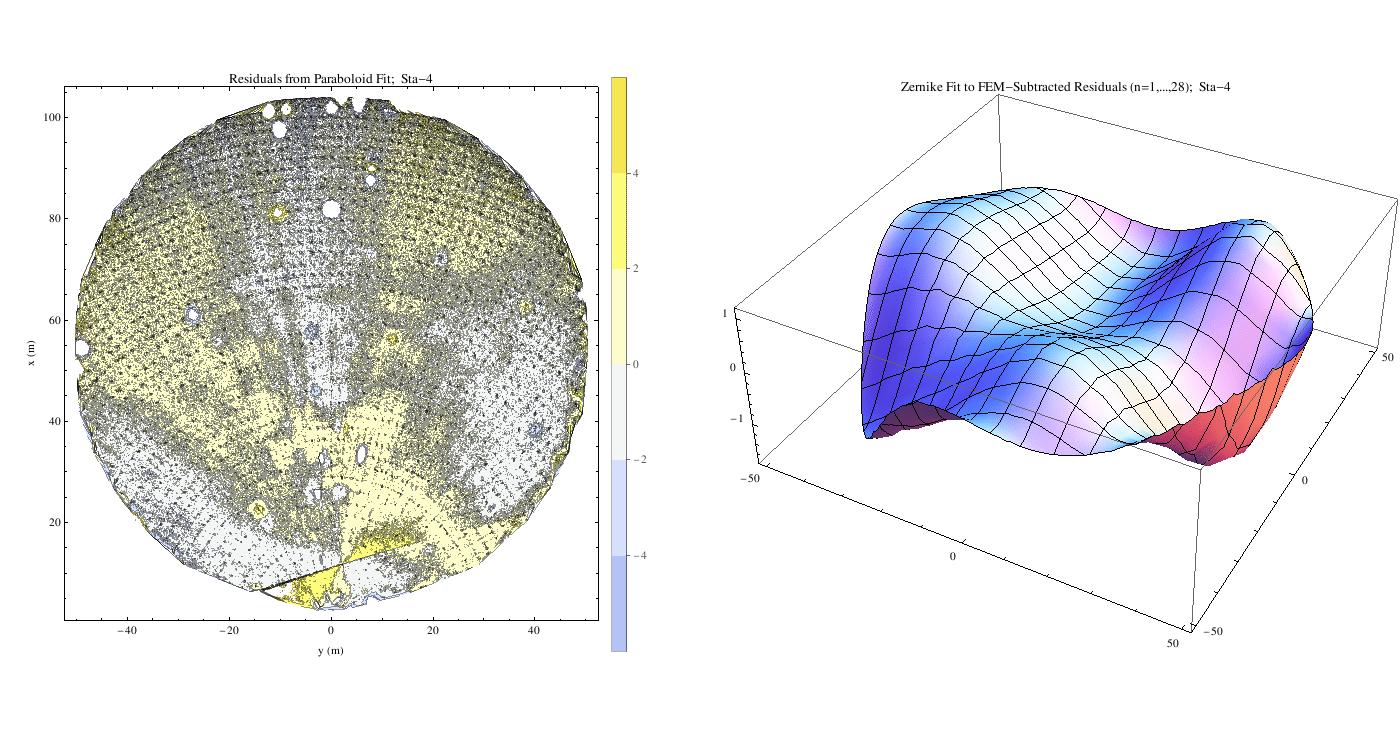
| n | coef. | σ |
| 1 | -8 | 2 |
| 2 | -31 | 4 |
| 3 | 1 | 4 |
| 4 | 56 | 4 |
| 5 | -27 | 3 |
| 6 | -78 | 4 |
| 7 | -891 | 5 |
| 8 | 161 | 5 |
| 9 | 430 | 5 |
| 10 | 828 | 5 |
| 11 | -69 | 5 |
| 12 | -7 | 6 |
| 13 | -149 | 4 |
| 14 | -293 | 6 |
| 15 | 16 | 5 |
| 16 | -161 | 6 |
| 17 | 650 | 6 |
| 18 | 241 | 6 |
| 19 | -333 | 6 |
| 20 | -450 | 6 |
| 21 | -191 | 6 |
| 22 | 106 | 6 |
| 23 | 293 | 6 |
| 24 | 106 | 6 |
| 25 | 236 | 5 |
| 26 | -2 | 6 |
| 27 | -261 | 6 |
| 28 | 108 | 6 |
![]()
![]()
![]()