![]()
![]()
![]()
![]()
![]()
![]()
![]()
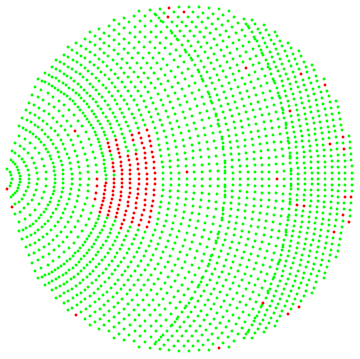
![]()
![]()
![]()
| Estimate | Standard Error | t-Statistic | P-Value | |
| x0 | 11.6833 | 0.000357624 | 32669.2 | 2.56099725.932881625443367*^-372726 |
| y0 | 1.80624 | 0.000418845 | 4312.43 | 6.80212779.932881625443367*^-197305 |
| z0 | -47.9616 | 0.0000742793 | -645692. | 5.76106224.932881625443367*^-631888 |
| phi | 1.20228 | 0.0000148166 | 81144. | 8.04736115.932881625443367*^-451741 |
| theta | -0.21851 | 3.10639*10^^-6 | -70342.2 | 1.43068440.932881625443367*^-439333 |
| fl | 60.0778 | 0.000191674 | 313438. | 4.60449536.932881625443367*^-569115 |
![]()
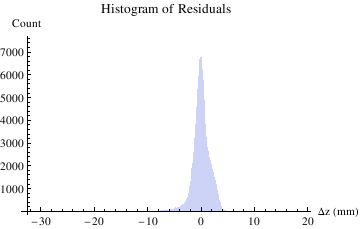
![]()
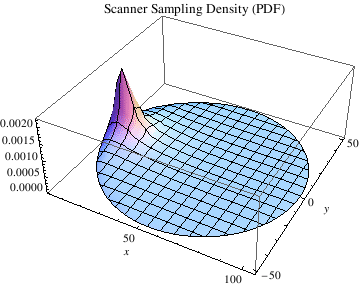
![]()
![]()
![]()
![]()
| Estimate | Standard Error | t-Statistic | P-Value | |
| x0 | 11.7138 | 0.000196419 | 59636.9 | 2.00030919.412583916135588*^-1131879 |
| y0 | 1.82538 | 0.000219344 | 8321.98 | 2.76043480.412583916135588*^-619813 |
| z0 | -47.9552 | 0.0000361693 | -1.32585*10^^6 | 1.17282285.412583916135588*^-1940037 |
| phi | 1.20205 | 7.35568*10^^-6 | 163418. | 6.87787128.412583916135588*^-1394529 |
| theta | -0.218784 | 1.61517*10^^-6 | -135455. | 2.32797338.412583916135588*^-1345628 |
| fl | 60.0687 | 0.000108295 | 554676. | 1.83287377.412583916135588*^-1712966 |
![]()
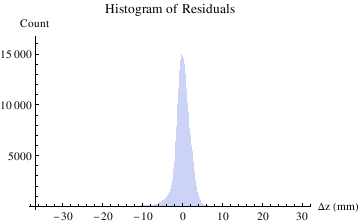
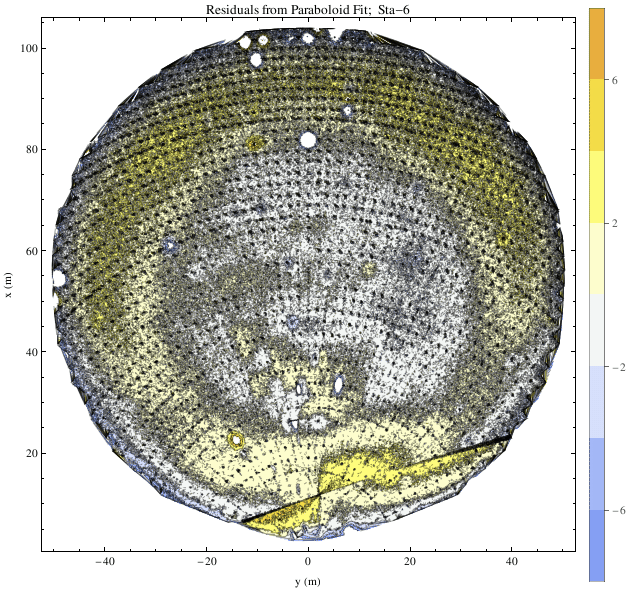
![]()
![]()
![]()
![]()
| n | coef. | σ |
| 4 | -150 | 5 |
| 5 | 372 | 4 |
| 6 | -108 | 5 |
| 7 | -281 | 6 |
| 8 | 846 | 6 |
| 9 | -86 | 6 |
| 10 | 855 | 6 |
| 11 | 233 | 6 |
| 12 | 74 | 7 |
| 13 | -1647 | 5 |
| 14 | -186 | 6 |
| 15 | 387 | 6 |
| 16 | -206 | 7 |
| 17 | 348 | 7 |
| 18 | 65 | 7 |
| 19 | -491 | 7 |
| 20 | -553 | 7 |
| 21 | 55 | 7 |
| 22 | 172 | 7 |
| 23 | 148 | 7 |
| 24 | -108 | 8 |
| 25 | -1477 | 5 |
| 26 | -107 | 7 |
| 27 | -193 | 7 |
| 28 | 154 | 7 |
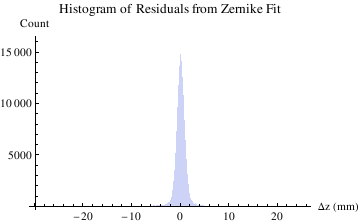
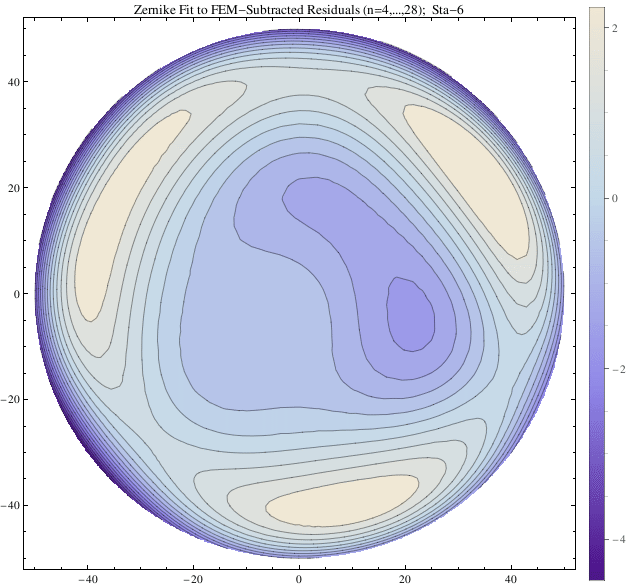
![]()
![]()
![]()
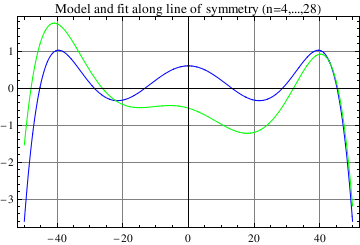
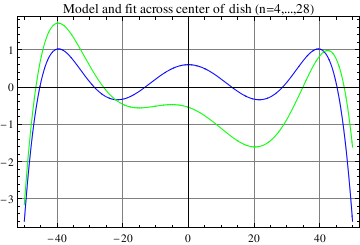
![]()
![]()
![]()
![]()
| n | coef. | σ |
| 1 | 112 | 2 |
| 2 | 34 | 4 |
| 3 | 154 | 4 |
| 4 | -144 | 5 |
| 5 | 354 | 4 |
| 6 | -114 | 5 |
| 7 | -280 | 6 |
| 8 | 836 | 6 |
| 9 | -117 | 6 |
| 10 | 856 | 6 |
| 11 | 233 | 6 |
| 12 | 79 | 7 |
| 13 | -1671 | 5 |
| 14 | -191 | 6 |
| 15 | 388 | 6 |
| 16 | -205 | 7 |
| 17 | 347 | 7 |
| 18 | 51 | 7 |
| 19 | -524 | 7 |
| 20 | -557 | 7 |
| 21 | 58 | 7 |
| 22 | 173 | 7 |
| 23 | 149 | 7 |
| 24 | -108 | 8 |
| 25 | -1498 | 5 |
| 26 | -111 | 7 |
| 27 | -197 | 7 |
| 28 | 153 | 7 |
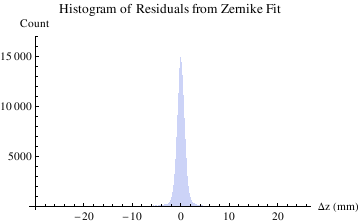
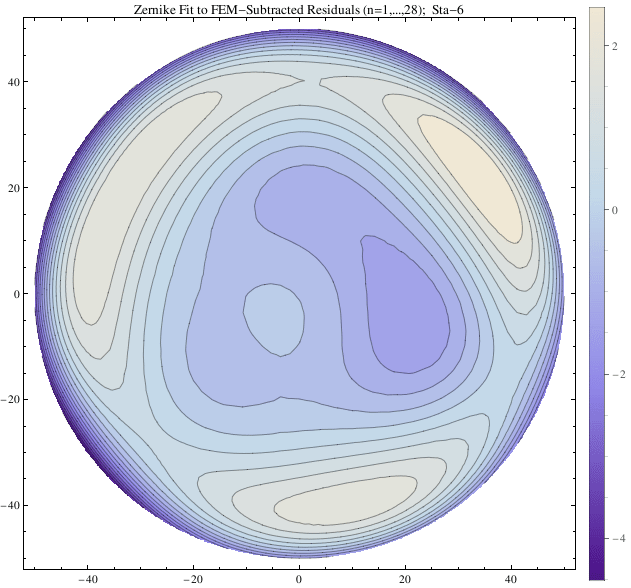
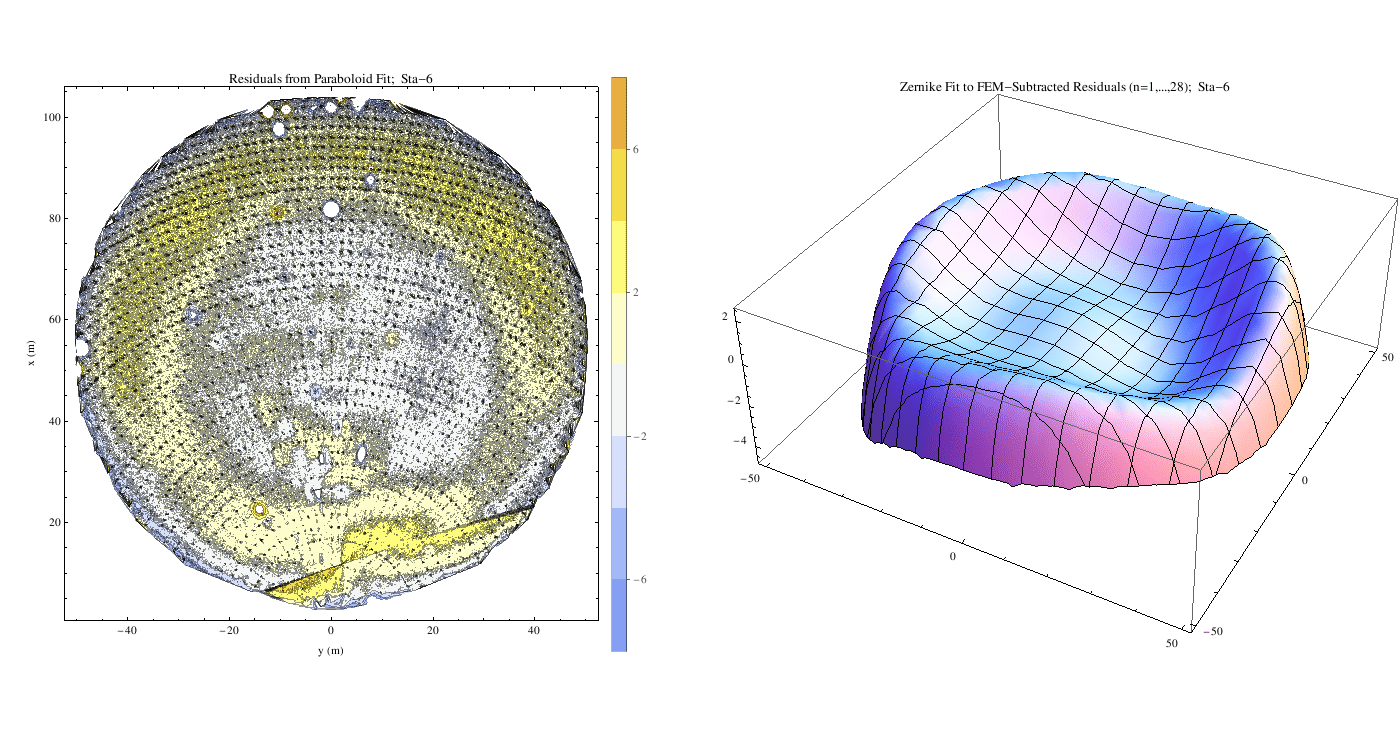
![]()
![]()
![]()
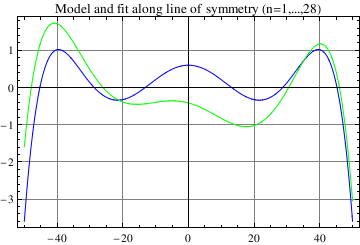
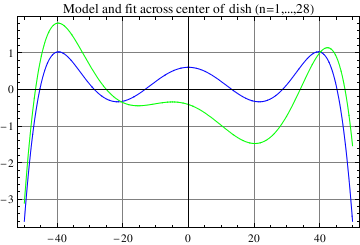
![]()