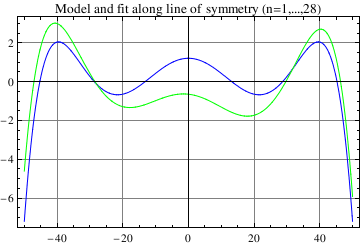
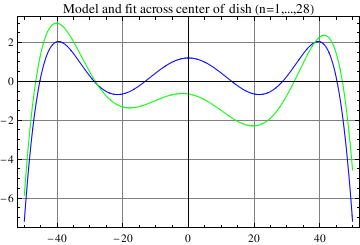
![]()
![]()
![]()
![]()
![]()
![]()
![]()
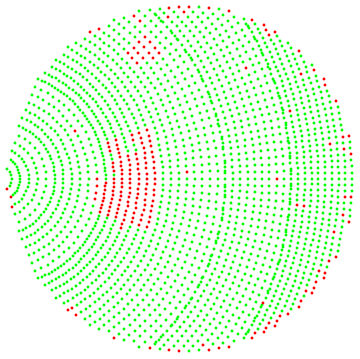
![]()
![]()
![]()
| Estimate | Standard Error | t-Statistic | P-Value | |
| x0 | 11.6868 | 0.000489658 | 23867.2 | 5.78711129.932881625443367*^-345467 |
| y0 | 1.81024 | 0.000574226 | 3152.48 | 2.11151119.932881625443367*^-170492 |
| z0 | -47.9615 | 0.000101733 | -471442. | 2.23120588.932881625443367*^-604569 |
| phi | 1.20201 | 0.0000203094 | 59185. | 6.73387454.932881625443367*^-424334 |
| theta | -0.218472 | 4.2551*10^^-6 | -51343.5 | 7.46271250.932881625443367*^-411990 |
| fl | 60.0888 | 0.000262707 | 228729. | 6.67058322.932881625443367*^-541750 |
![]()
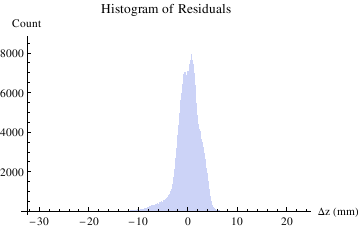
![]()
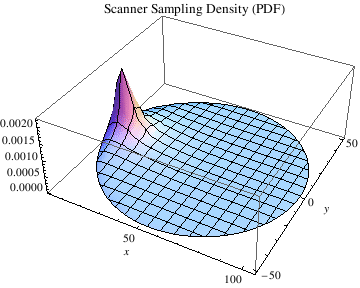
![]()
![]()
![]()
![]()
| Estimate | Standard Error | t-Statistic | P-Value | |
| x0 | 11.7266 | 0.000264909 | 44266.7 | 4.24004845.412583916135588*^-1054235 |
| y0 | 1.83434 | 0.000294834 | 6221.63 | 1.41041821.412583916135588*^-544900 |
| z0 | -47.9533 | 0.0000487031 | -984604. | 5.28899219.412583916135588*^-1862498 |
| phi | 1.20175 | 9.90017*10^^-6 | 121387. | 1.16771723.412583916135588*^-1317055 |
| theta | -0.218821 | 2.17513*10^^-6 | -100601. | 2.97884368.412583916135588*^-1268117 |
| fl | 60.078 | 0.000146093 | 411231. | 1.60035201.412583916135588*^-1634995 |
![]()
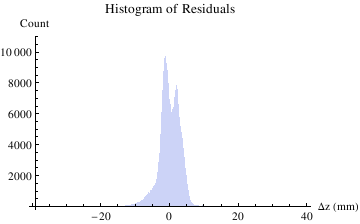
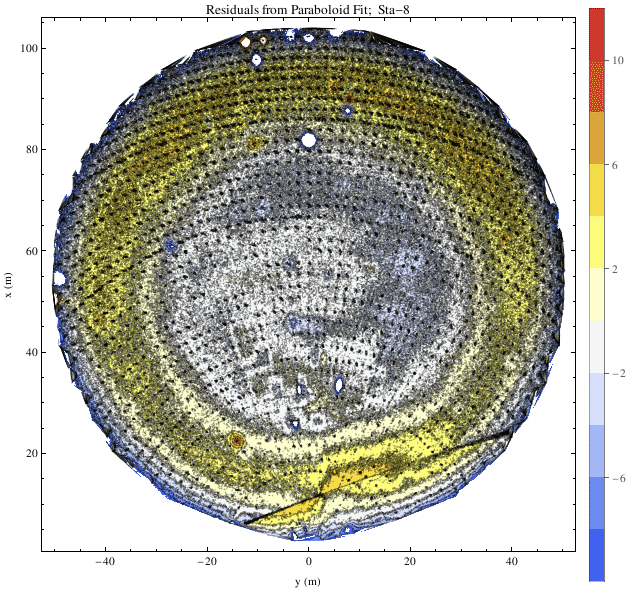
![]()
![]()
![]()
![]()
| n | coef. | σ |
| 4 | -195 | 5 |
| 5 | 773 | 4 |
| 6 | -66 | 5 |
| 7 | -323 | 6 |
| 8 | 813 | 6 |
| 9 | -57 | 6 |
| 10 | 682 | 6 |
| 11 | 8 | 6 |
| 12 | 180 | 7 |
| 13 | -3225 | 5 |
| 14 | -28 | 7 |
| 15 | 325 | 6 |
| 16 | -304 | 7 |
| 17 | 320 | 7 |
| 18 | 80 | 7 |
| 19 | -408 | 7 |
| 20 | -457 | 7 |
| 21 | -109 | 7 |
| 22 | 119 | 7 |
| 23 | 189 | 8 |
| 24 | -85 | 8 |
| 25 | -3084 | 5 |
| 26 | -17 | 8 |
| 27 | -171 | 8 |
| 28 | 174 | 7 |
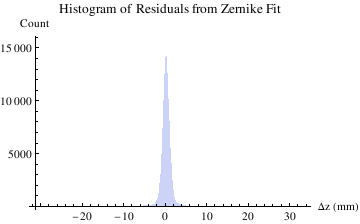
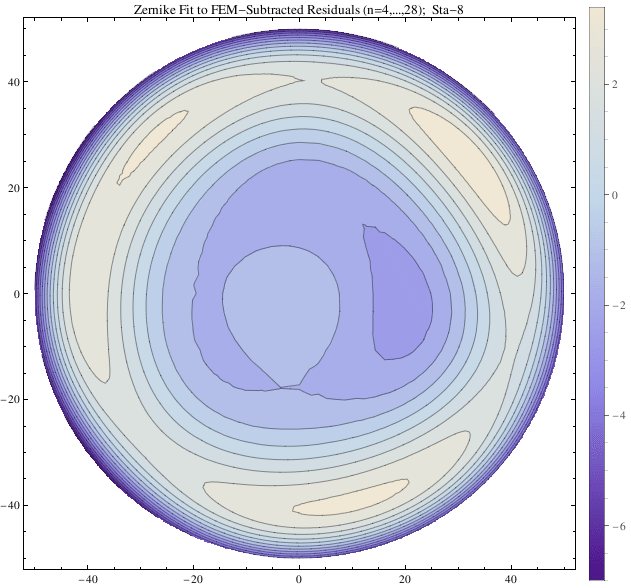
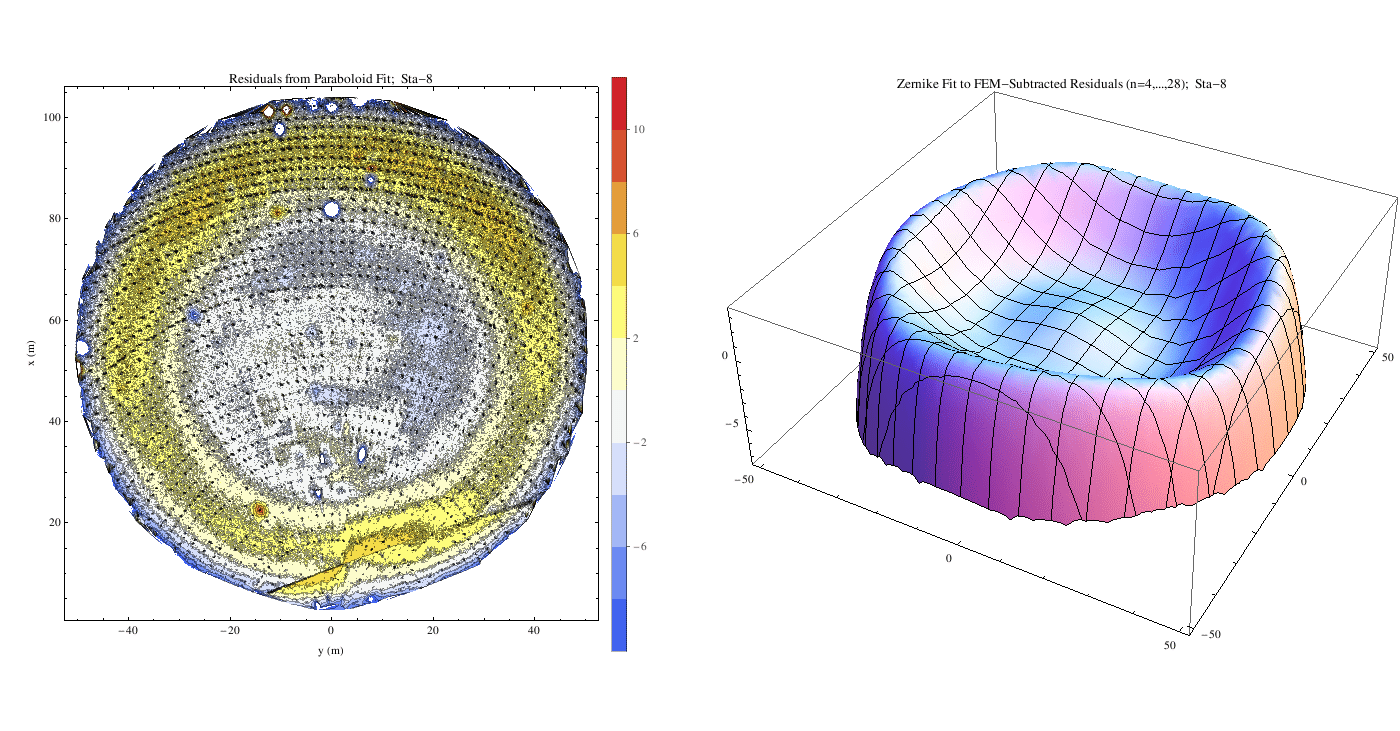
![]()
![]()
![]()
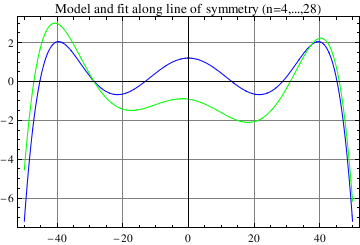
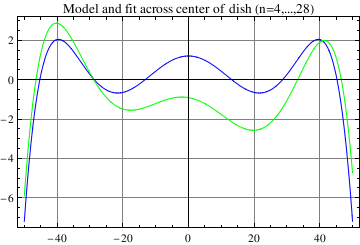
![]()
![]()
![]()
![]()
| n | coef. | σ |
| 1 | 226 | 2 |
| 2 | 134 | 4 |
| 3 | 251 | 4 |
| 4 | -189 | 5 |
| 5 | 736 | 4 |
| 6 | -78 | 5 |
| 7 | -323 | 6 |
| 8 | 782 | 6 |
| 9 | -108 | 6 |
| 10 | 683 | 6 |
| 11 | 8 | 6 |
| 12 | 186 | 7 |
| 13 | -3271 | 5 |
| 14 | -39 | 6 |
| 15 | 322 | 6 |
| 16 | -300 | 7 |
| 17 | 318 | 7 |
| 18 | 44 | 7 |
| 19 | -467 | 7 |
| 20 | -460 | 7 |
| 21 | -107 | 7 |
| 22 | 120 | 7 |
| 23 | 191 | 7 |
| 24 | -89 | 8 |
| 25 | -3129 | 5 |
| 26 | -25 | 7 |
| 27 | -177 | 7 |
| 28 | 175 | 7 |
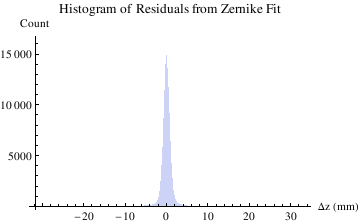
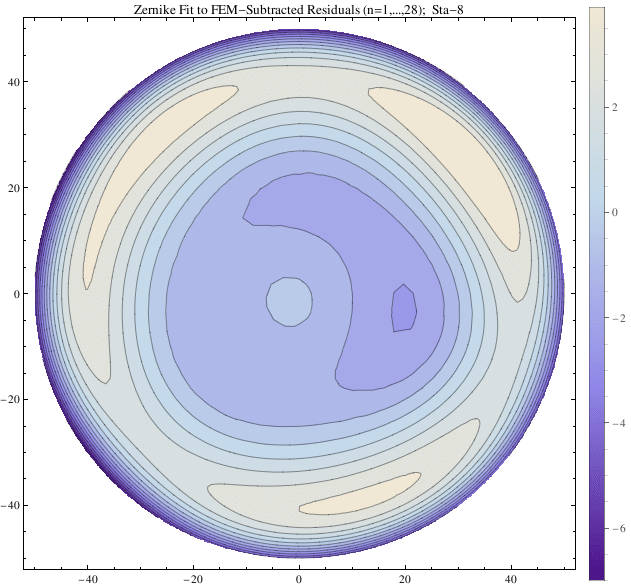
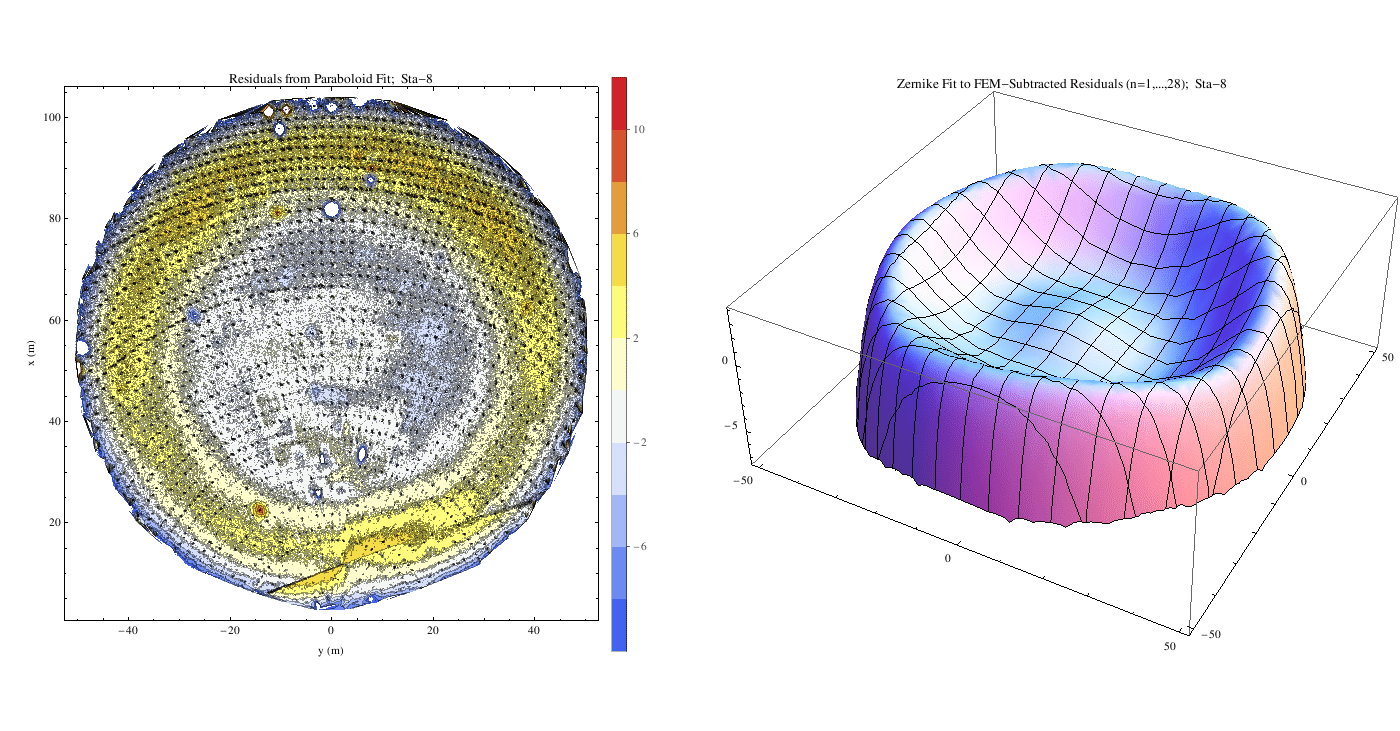
![]()
![]()
![]()
