![]()
![]()

![]()
![]()
![]()
![]()
![]()
![]()
![]()
![]()
![]()
![]()
![]()
![]()
![]()
Needs["HierarchicalClustering`"]
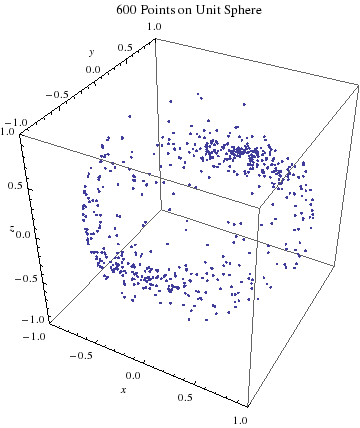
(* Generate a random collection of points on the unit sphere: *)
n=600;
randompoint:=Module[{v},
v=RandomVariate[NormalDistribution[0,1],3];
v={1,3,1/3}v;
v/Norm[v]];
list=Table[randompoint,{n}];
plt1=ListPointPlot3D[list,PlotRange->{{-1,1},{-1,1},{-1,1}},
AxesLabel->{x,y,z},
PlotLabel->ToString[n]<>" Points on Unit Sphere",
BoxRatios->{1,1,1}];
Print[plt1];
(* Hierarchical Clustering code: *)
hclust[linkage_:"Complete"]:=Module[{},
df=ArcCos[#1.#2]/Degree&;
dmat=DistanceMatrix[list,DistanceFunction->df];
da=DirectAgglomerate[dmat,Linkage->linkage];
plt=DendrogramPlot[da,Orientation->Right,
PlotRange->{All,{0,n+1}},
Frame->{True,False},FrameLabel->{"Angular Distance (deg)",""},
GridLines->Automatic,GridLinesStyle->Directive[Dashed,Green],
LeafLabels->(#&),
AspectRatio->(4/3 14 n)/(14 72),
ImageSize->{7 72,Automatic},
PlotLabel->"Hierarchical Agglomerative Clustering Example, Using "<>
linkage<>" Linkage Option"];
plt]
(* Linkage options: *)
lopts={"Single","Average","Complete","WeightedAverage","Centroid","Median"}
(* Now try the "FindClusters" clustering code: *)
df=ArcCos[#1.#2]/Degree&;
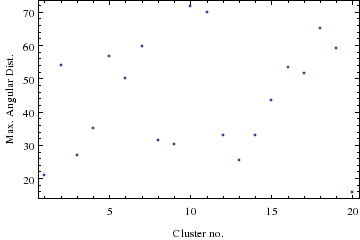
maxdist[cluster_]:=Module[{nc,tab,ftab},
nc=Length[cluster];
If[nc===1,Return[0]];
tab=Table[df@@{cluster[[i]],cluster[[j]]},{i,1,nc-1},{j,i+1,nc}];
ftab=Flatten[tab];
Max[ftab]]
(* See what happens if one chooses nc clusters: *)
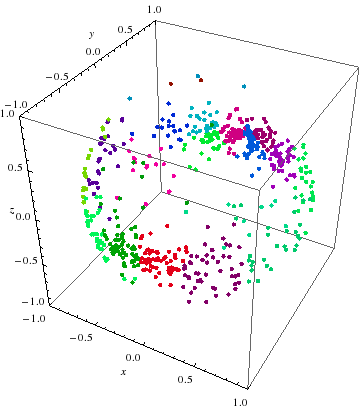
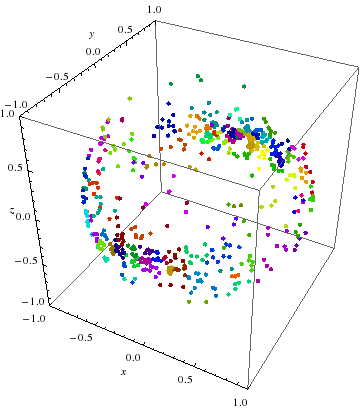
try[nc_]:=Module[{(*clist,diams,nos,pplot,dplot*)},
clist=FindClusters[list,nc,DistanceFunction->df,Method->"Optimize"];
diams=Map[maxdist,clist];
nos=Map[Length,clist];
pplot=ListPointPlot3D[clist,PlotRange->{{-1,1},{-1,1},{-1,1}},
AxesLabel->{x,y,z},
PlotStyle->Table[{PointSize[Medium],
Hue[Random[],1,RandomReal[{.5,1}]]},{nc}],
BoxRatios->{1,1,1}];
Print[pplot];
Print[nc," Clusters"]
Print["Median number per cluster = ",Median[nos]//N];
Print["Average number per cluster = ",Mean[nos]//N];
Print["Median largest angular distance = ",Median[diams]];
Print["Mean largest angular distance = ",Mean[diams]];
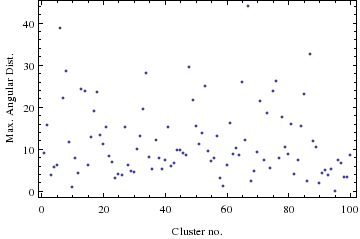
dplot=ListPlot[diams,PlotRange->All,
Frame->True,
FrameLabel->{"Cluster no.","Max. Angular Dist."}]]