The HI Kinematics and Distribution of Four Blue Compact Dwarf Galaxies
We present VLA HI observations of the Blue Compact Dwarf (BCD)
galaxies NGC 2366, NGC 4861, VII Zw 403 and Haro 2. These galaxies
span a range of BCD morphological types. The cometary-like BCDs NGC
2366 and NGC 4861 have regular rotational kinematics with a V/sigma
of 8.7 and 6.4, respectively. On the other hand, the velocity fields
of the iE BCD VII Zw 403 and of the nE BCD Haro 2 lack regularity and
their rotational motion is around the major, not the minor axis.
The HI distribution is centrally peaked in VII Zw 403 and Haro 2, a
general feature of all iE and nE-type BCDs, the most common ones. By
contrast, cometary-type BCDs have multiple HI peaks which are
scattered over the disk. The active regions of star formation are
associated with regions of high HI column densities, with slight
displacements between the HI and stellar peaks. NGC 2366 shows many HI
holes, resulting from the disruptive influence of massive star
formation and supernovae on the interstellar medium (ISM). In all
BCDs, there is a tendency for HI gas with higher velocity dispersion
to be associated with regions of lower HI column density. This
anti-correlation can be understood in the context of a two-phase model
of the ISM. In all BCDs, the radio continuum emission is associated
with the star-forming regions and is predominantly thermal in
nature. HI clouds with no optical counterparts have been found in the
vicinity of NGC 4861 and Haro 2.
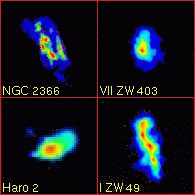
RIGHT: False color of integrated HI intensity of the four systems studied.
The following list provides links to the
color images for each of the systems (figures published in b/w).
Mosaics are 6-panel representations of
the data, arranged in the following order:
Top Left: Digitized Sky Survey (DSS)
with a deep stretch to show the extent of the galaxy.
Top Right: Digitized Sky Survey with a shallow stretch to
show the star-forming regions.
Middle Left: Lower resolution total HI in contours over the DSS
in greyscale.
Middle Right: Lower resolution total HI, but in greyscale.
Bottom Left: Higher resolution HI velocity field, in both
contours and greyscale.
Bottom Right: Higher resolution HI velocity dispersion in
greyscale, with total HI in contours.
Details are a blow-up of the area around
the most active starforming regions in each system,
Left: High-resolution Radio continuum contours on Optical CCD image in
false color.
Middle: High-resolution integrated HI contours on Optical CCD image in
false color.
Right: High-resolution integrated HI contours on HI velocity
dispersion false color
Channel Maps are channel maps.
- NGC 2366/3 (=UGC 3851=Mrk 71=DDO 42)
- I Zw 49 (=NGC 4861=UGC 8098=Arp 266=Mrk 59=IC 3961=VV 797)
- VII Zw 403 (=UGC 6456=VV 574)
- Haro 2 (=UGC 5720=Arp 233=Mrk 33)
Back
to home
Maintained by jhibbard @ nrao.edu
Last modified: Fri Jul 30 17:37:04 EDT 2004
