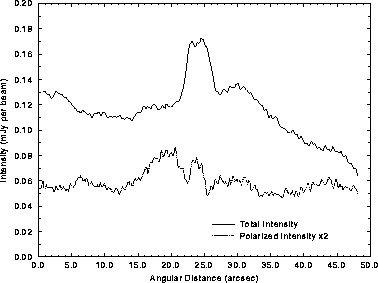
Figure 2: Averaged transverse profiles across the segment of the jet
between the brightest knots: 8.4 GHz, 0.44" (FWHM)
resolution.
Upper: total intensity. Lower: polarized
intensity ×2, showing two minima.
The transverse intensity profiles are flat-topped in many regions (see Figure 2, upper curve). The profiles are poorly fitted by single Gaussian components wherever the signal-to-noise is high. Residuals from Gaussian fits are always positive toward the edges of the jet, and negative toward the jet axis.