Thermal dependency plots of Speake magnetometers.
Darrel Emerson, April 9 2000
Measurements of the dependency of the FGM-3 frequency on temperature,
and the variation of that dependency with temperature

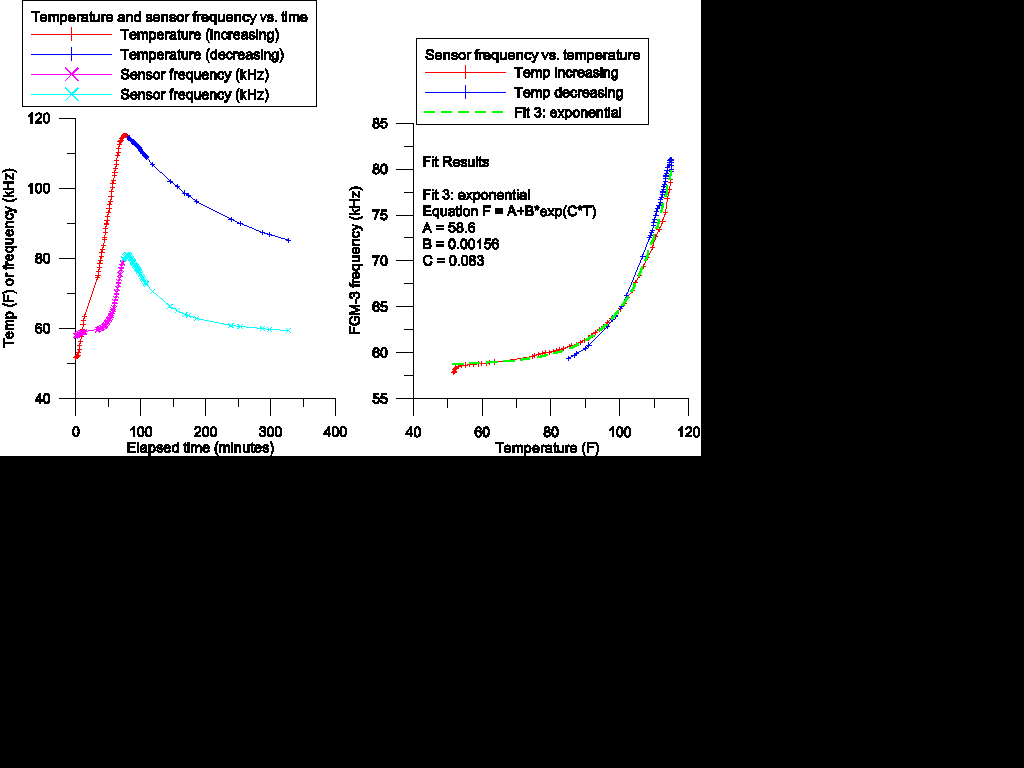
Temperature and frequency vs. time (left) and
Frequency vs. Temperature (right)
The above plots show the raw measurements of sensor frequency and
temperature, first against time, and secondly frequency plotted against
temperature. Different colors distinguish data taken with temperature
increasing from measurements with temperature decreasing with time.
On the left plot, the fact that the peak of sensor frequency
at about 80 minutes is clearly sharper than the temperature profile,
demonstrates how the temperature dependency increases with temperature.
The right plot, plotting frequency against temperature, shows this
quite clearly. The curve fits an exponential expression surprisingly
well; the
green dashed line shows the best fit exponential curve to the data
taken with temperature increasing with time. The best fit
coefficients values are printed within the plot.

Temperature dependency of FGM-3 (sensor #7) versus temperature
The above plot was made by measuring the frequency output and temperature
of the FGM-3 sensor, as it was first gradually warmed up from about
50 degs to about 110 degs F, and then continuing the measurements
as the sensor cooled down. For these measurements the sensor was
immersed in a container of water, with a thermistor strapped to the
sensor. Sensor and thermistor were kept dry inside a thin polythene
bag. The sensor was aligned approximately magnetic E-W, so the vector
component of the magnetic field sensed by the FGM-3 is approximately
zero. Measurements shown here were taken over a period of about 5 hours.
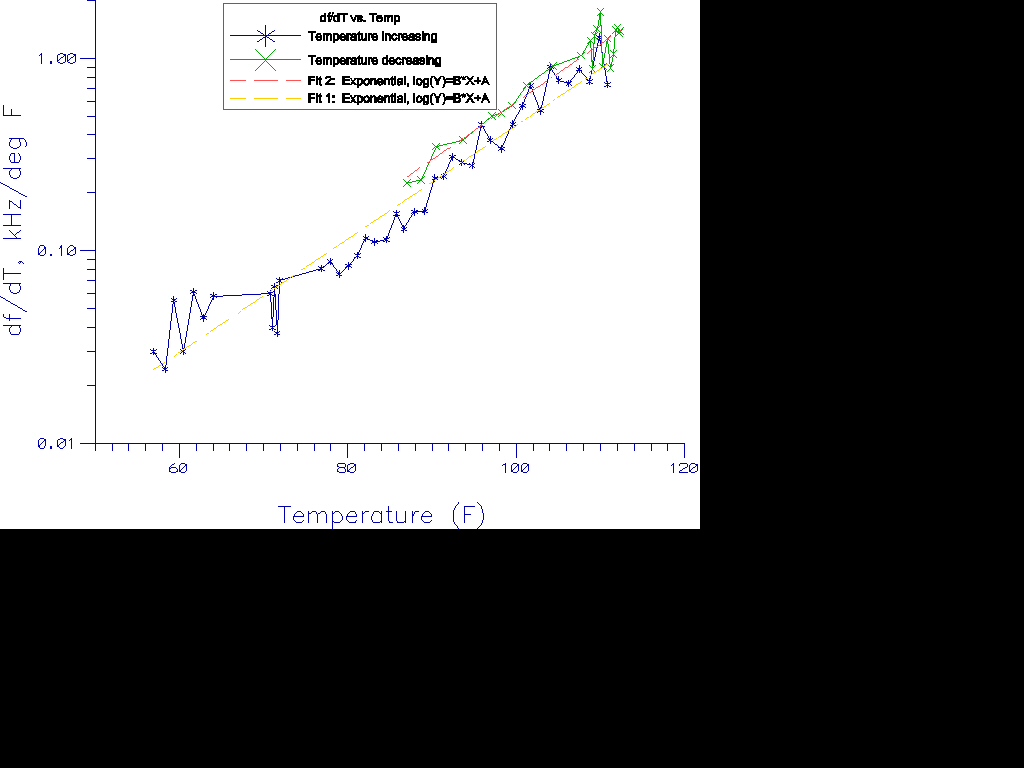
The data were analysed by ploting sensor frequency against sensor
temperature, then measuring the slope of that plot as a function of
temperature. This slope (df/dT) is plotted above.
Note the log scale of the Y-axis. The higher noise at lower temperatures
results from inaccuracies in temperature measurements; the measured
temperatures were digitized in about 0.2 F steps. The noise at higher
temperatures is worse because near the maximum temperature reached
(about 110 F) both rate of change of temperature with time and the
rate of change of sensor output frequency become zero, so the
ratio of the gradients is poorly determined there.
There is a systematic displacement of the heating up and cooling down
measurements. I believe this is because of a small time delay in
the sensor reaching an equilibrium temperature, compared to the thermistor
strapped to its outside. This systematic offset is relatively small
in the context of these measurements; its value sets a limit on
the error from temperatures not quite reaching equilibrium. The true
curve is somewhere between the heating and cooling curves.
An empirical fit to an exponential function is shown. For the
data taken with temperature increasing with time, the fit is
df/dT (Hz/deg F) = 0.5 * e0.068*T
with T measured in degs F.
Representative values of the coefficient df/dT (Hz/deg F) are shown
in the table below.
| Coefficient df/dT for FGM-3 #7 |
|---|
| Temp (F) | Freq (kHz) | Coefficient
(Hz/deg F) |
| 60 | 58.85 | 40 |
| 80 | 60.1 | 90 |
| 90 | 61.4 | 190 |
| 100 | 64.7 | 490 |
| 110 | 72.6 | 980 |
These measurements should be read in the context of earlier calibration
measurements. See
Fluxgate Magnetometer Tests
and
FGM-3h: Thermal Effects and Long Term Drift
.
�

