by Darrel Emerson, AA7FV and G3SYS
QST,  published by ARRL.
 Vol 79, No. 2, February 1995,  p.21.
(Copyright on the original article is held by the ARRL.)
In July 1991 and in May 1994, partial solar eclipses were visible from the QTH of AA7FV in Tucson Arizona. For both events, a simple Yagi antenna was left pointing in advance at the mid-point of the eclipse, and the total noise output power from a ham radio receiver, tuned either to 146 MHz or to 436 MHz, was recorded.
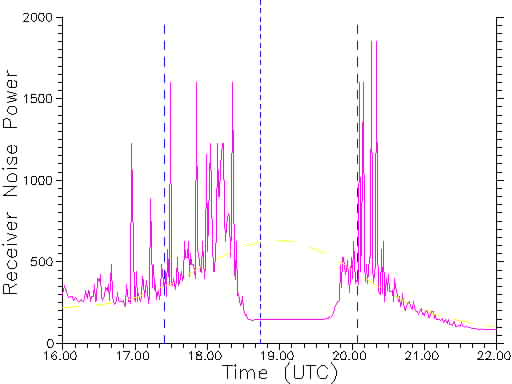
During the July 1991 event, the sun was quite active. The trace below shows the signal recorded at 146 MHz over a period of 6 hours. The vertical dashed lines show the times of start, maximum obscuration, and ending of the optical eclipse. The base noise level gradually rises as the sun drifts into the antenna beam, with strong solar bursts superposed.
The solar noise drops fairly abruptly about 1 hour after the onset of the eclipse, but returns about 13 minutes before the end of the eclipse. This shows that the region producing the radio emission must be fairly small, and definitely not covering any substantial part of the optical disk. By about 21:00 UT, an hour or so after the end of the eclipse, the sun is drifting out of the Yagi antenna beam.
By calculating where the leading edge of the moon was over the sun at the point where the radio radiation disappears, and combining this with knowledge of where the trailing edge of the moon was as the radio emission reappears, it is possible to pinpoint the source of radio emission very precisely. Also, by measuring just how rapidly the radio emission disappeared and reappeared, it is possible to estimate the size of the radiating region on the solar surface. This comes out to about one hundredth of a degree.
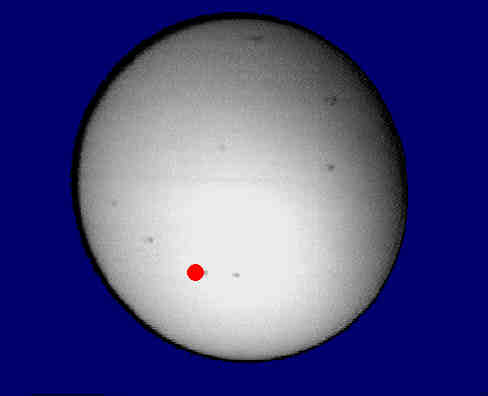
The image below shows the optical sun photographed with a telescope and CCD camera just before the start of the eclipse, by Tom Folkers in Tucson, Arizona. Several sunspot regions can be seen. The red spot shows the location and approximate extent of the source of intense radio emission. The radiation seems to be associated with, although not completely coincident with, a fairly prominent sunspot group.
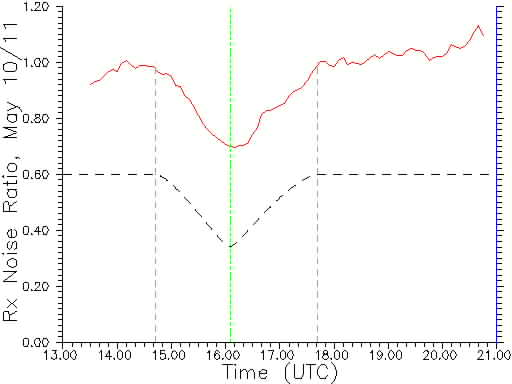
In May 1994 the sun was very quiet, unlike the July 1991 event. Radio emission at 146 MHz was barely discernible from the general galactic background radiation. The situation was a little clearer at 436 MHz however. The solid trace below shows the emission detected at 436 MHz over an 8-hour period on the day of the eclipse, but normalized by an identical observation made the following day. This normalization removes the effect of galactic background emission drifting through the antenna beam. The vertical, dashed lines mark the times of onset, maximum obscuration, and ending of the optical eclipse.
The lower, dashed line in the figure shows the change in solar emission expected if the radio emission comes from a smooth disk, equal in extent to the optical sun. The two curves match fairly well, showing that, at this part of the solar sunspot cycle, most of the emission at 436 MHz comes from a fairly smooth solar disk, in complete contrast to the 1991 measurements at 146 MHz.
Please refer to the original article in QST, February 1995 for details, including how the measurements were made, and for a derivation of solar brightness temperatures and an estimate of the flux of the solar noise storm.