![]()
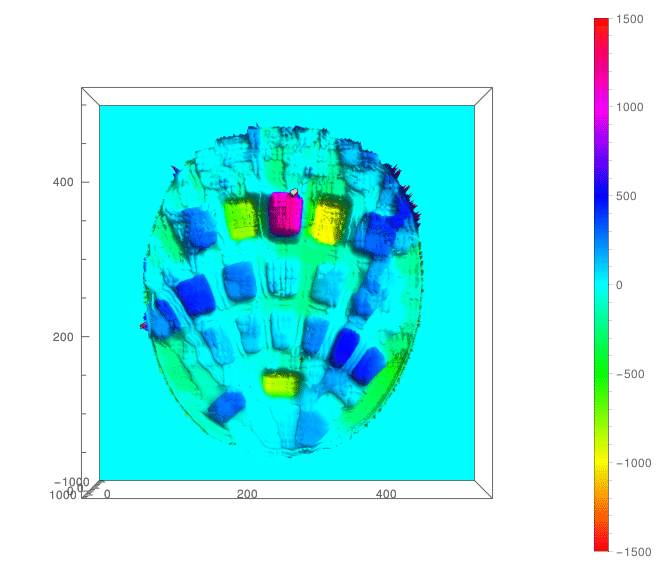
Bump Scan Sta-14 Results
In the data analysis, residuals from best-fit paraboloid are computed for each bump scan and each baseline scan. Here we show the result of subtracting from the gridded Sta-14 bump scan residuals the average, pixel by pixel, of gridded residuals from two baseline scans, Sta-10 and Sta-14. We use a grid size of 512 × 512. You can control the viewing perspective via the left mouse button (you can also enlarge the display by clicking and dragging on one corner of the image):
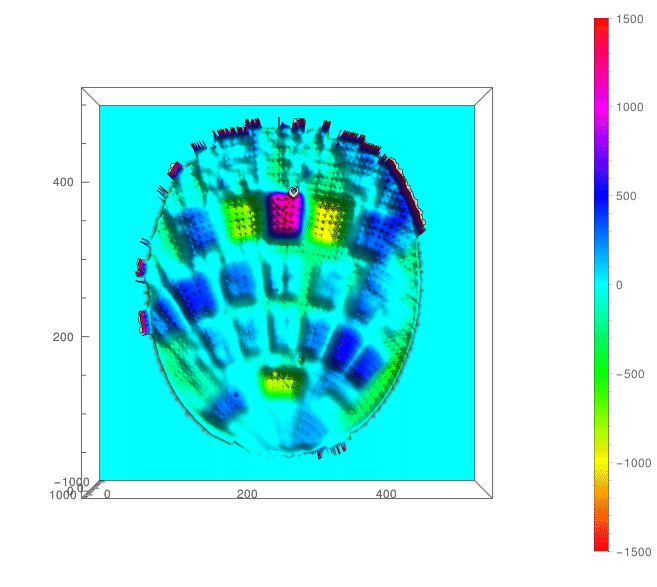
Here is the result of applying an edge-preserving nonlinear smoothing filter (the so-called Kuwahara filter). The filter width chosen here is 15 × 15 pixels: