Figure: Non-cadenced data-a free-running observing sequence. Original PostScript figure (32kB).
Next: Titan Image Processing
Previous: Mapping the Jagiellonian Field of Galaxies
Up: Algorithms
Table of Contents - Index - PS reprint
Rob Seaman
IRAF Group, NOAO, PO Box 26732, Tucson, AZ 85726
Caty Pilachowski, Sam Barden
Kitt Peak National Observatory
Such oscillations are best detected as a beat frequency relative to some very regular inertial observing cadence. The phase of the cadence must be maintained, both between widely separated telescopes and between observing sessions that may be separated by months.
We discuss techniques to improve the observing efficiency and the likelihood of detection. Precisely identical data handling and reduction steps for tens or hundreds of thousands of spectra are critical to success.
[1]Image Reduction and Analysis Facility, distributed by NOAO [2]National Optical Astronomy Observatories, operated by the Association of Universities for Research in Astronomy, Inc. (AURA) under cooperative agreement with the NSF.
The detection and study of acoustic oscillations in solar-like stars offer a new constraint on stellar models, beyond the global properties of mass, radius, age, and chemical composition. For stars with well-measured global properties, knowledge of frequencies and frequency splittings of p-mode oscillations will permit detailed comparison with stellar models at a level unprecedented outside the solar system. For stars whose global properties are less well known, the addition of asteroseismological data may allow the determination of mass and age for individual field stars. The observation of many solar-like stars will also help us to understand how solar p-modes are excited and damped.
The Stellar Oscillations Network Group (SONG) at NOAO has undertaken to develop methodology for precise equivalent width measurements of Balmer lines in solar type stars. Typical oscillation frequencies in solar type stars are a few mHz, or a period of a few minutes. The amplitude of spectral line variations in integrated sunlight is about 5mÅ, but larger amplitudes (20-30mÅ) are expected in warmer stars. Time series of spectra are obtained over many nights at precisely timed intervals. Exposure times are limited to a few minutes or less by the need to preserve time resolution. Very high S/N ratios (~1000) are needed per exposure to detect the weak signal. With telescopes of modest aperture (4 meters or less), only the brightest stars can be observed.
Such measurements can be made with commonly available spectrographs. With the expectation of developing a world-wide network of telescopes to make asteroseismic observations, we are developing techniques of data acquisition, data reduction, and analysis that can be easily propagated to observatories around the world. Of greatest concern is high observing efficiency so that oscillations can be detected during observing runs of reasonable length.
While the potential of asteroseismology is great, so are the difficulties in detecting oscillations in solar type stars. In integrated light, the amplitudes of oscillations are small: a few meters per second in radial velocity or a few to a few dozen parts per million in the strength of spectral lines. New techniques in spectroscopy, data reduction, and analysis are needed to obtain this precision.
Complications are encountered when attempting to implement even the simplest requirements for conducting a valid sequence of asteroseismological observations. SONG hopes to detect stellar oscillations with periods of a few minutes or tens of minutes. Naively, the two or three orders of magnitude improvement over this provided by the normal 1 second time resolution of the KPNO CCD cameras should be quite sufficient for such a detection.
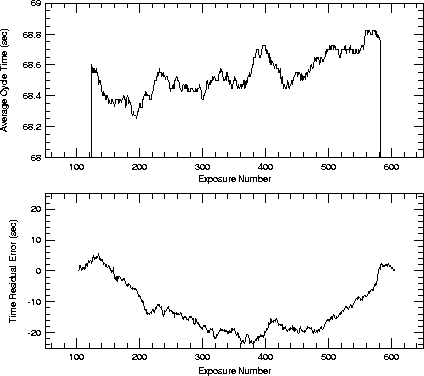
For this to be true, however, the scheduling of the individual CCD exposures also has to match at least this level of accuracy. Our first proof-of-concept observing night at the telescope relied on a long free-running sequence of several hundred exposures to provide this scheduling. Figure 1a is a plot of the running average of the cycle time (from shutter-open to shutter-open) versus sequence number through the night. The repeatability of the cycle time is respectable-the mean deviation is well within the 1 second precision of the camera system.
The only remarkable thing about Figure 1a is a slight increasing trend of the average cycle time from about 68.3s at the beginning of the observing session to about 68.7s at the end of the session several hours later. We attribute this 0.6% effect to increasing hard disk seek times as the data partition filled up.

Figure: Non-cadenced data-a free-running observing sequence.
Original PostScript figure (32kB).
This small slope has a disproportionately dramatic effect, however, on the quality of the science that can be performed. Figure 1b is a plot of the residuals of the start time of each exposure compared to an evenly partitioned grid of precisely identical cadence from the start to the end of the observing sequence. These residuals sweep out more than 120° of phase in the nominally regular observing cadence. Without a regular cadence, the straightforward (in principle) detection of stellar oscillations as simple beat frequencies becomes more difficult. The much more complicated mathematical treatment required by unevenly gridded observations jeopardizes the reliability of any detection whatsoever, and at best comes at the expense of observing efficiency.
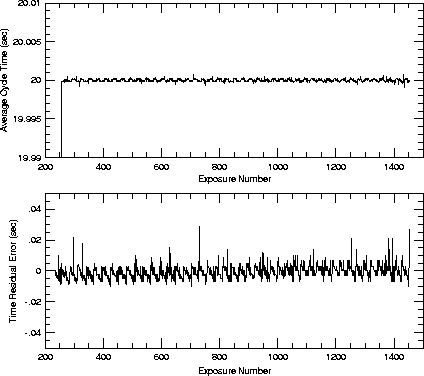
Clearly, some way is required to schedule the observations on regular clock ticks. We refer to this as ``cadencing'' the observations. A short delay is added to each exposure such that the shutter is opened on the precise clock tick desired. Figures 2a and 2b show the improvement realized after cadencing.

Figure: Cadenced data-shutter timed to better than 0.01s.
Original PostScript figure (59kB).
Having addressed the question of enforcing a regular observing cadence for a single observing sequence, the next complication arises. Our telescopes do not provide an inertial observing platform. Unless we account for the 1000s light travel time amplitude of the Earth's motion around the Sun, we cannot hope to easily combine data from observing runs separated by any significant fraction of a year. The problem is even more fundamental than this, since, except when a particular target is very near opposition to the Sun, the heliocentric correction can vary by several seconds over the course of a single day.
Note that the amplitude of the barycentric correction for the Solar system is about 10 light seconds-about 1% of the heliocentric correction. Jupiter contributes about half of the barycentric leverage and Saturn most of the rest. At any given epoch the absolute value of the barycentric effect may be significantly less than the full 10s, depending on Saturn's position relative to Jupiter.
It is the non-zero second derivative of these motions that will smear out the phase of the observations, since otherwise they could be treated like the typical target star's radial velocity term of a few km/s, which can just be compensated for as a small Doppler correction. For instance, Procyon's radial velocity is -3km/s; this will just require a 1 part in 105 Doppler correction.
As another way to increase efficiency, we investigated the use of a continuous readout mode (CRM) for spectra of bright stars to eliminate the time spent with the shutter closed. A major concern is the variation of the light across the spectrum during the observations. We simulated CRM observations using the Artdata package in IRAF. We created a CRM spectrum using the known pixel-to-pixel sensitivity variations of the CCD, and allowed the artificial spectrum to vary in intensity, position on the CCD, and width due to seeing during ``readout.'' The simulated spectra contain errors of up to 4% in intensity. The S/N in the final spectrum is ~500, no better than a normal observation in the same time.
A second approach for improving the observing efficiency is a stepped CCD readout mode producing ``miniframe'' images. Using a narrow region of interest covering the spectrum, multiple integrations can be obtained within a single image frame. The spectrograph shutter is closed between integrations, and the region of interest is read out into a buffer; repeated integrations are appended to the same buffer. With this stepped readout mode, a total integration time of 25-30 seconds can be obtained each minute without saturating the CCD. This compares to a total integration time of only 15-20 seconds using a conventional readout, nearly doubling our observing efficiency.
Stellar Oscillations Network Group
Massey, P., et al. 1996, An Observer's Guide to Taking CCD Data with ICE
Next: Titan Image Processing
Previous: Mapping the Jagiellonian Field of Galaxies
Up: Algorithms
Table of Contents - Index - PS reprint