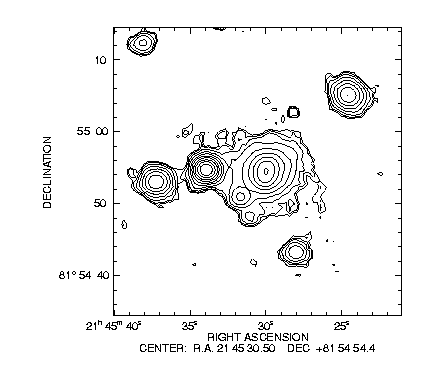
Figure 10: A contour plot of the V band surface brightness of
the region immediately surrounding the host galaxy of NVSS 2146+82.
The object just east of the host galaxy (at center) is a foreground
star. The remaining four discrete objects all have non-stellar PSFs,
indicating that they are very likely galaxies. The object to the
northwest of NVSS 2146+82 is a galaxy and has a spectroscopic redshift
from our WIYN program of z = 0.144.
In Figure 10, we present a
contour plot of the V band surface brightness from the central 40'' æ
40'' region
of the KPNO 4-m image after smoothing with a 3 pixel by 3 pixel boxcar
kernel. Although we find that the elliptical galaxy at the radio core
position (![]() ,
, ![]() J2000.0) has a narrow line AGN emission
spectrum with a redshift of z=0.145, we find that the object
just to the east, which was assumed to be potentially a second nucleus,
has a zero-redshift stellar spectrum, indicating it is a foreground
star. Figure 11 shows two plots of the wavelength and
flux calibrated spectrum of the host galaxy of NVSS 2146+82.
J2000.0) has a narrow line AGN emission
spectrum with a redshift of z=0.145, we find that the object
just to the east, which was assumed to be potentially a second nucleus,
has a zero-redshift stellar spectrum, indicating it is a foreground
star. Figure 11 shows two plots of the wavelength and
flux calibrated spectrum of the host galaxy of NVSS 2146+82.
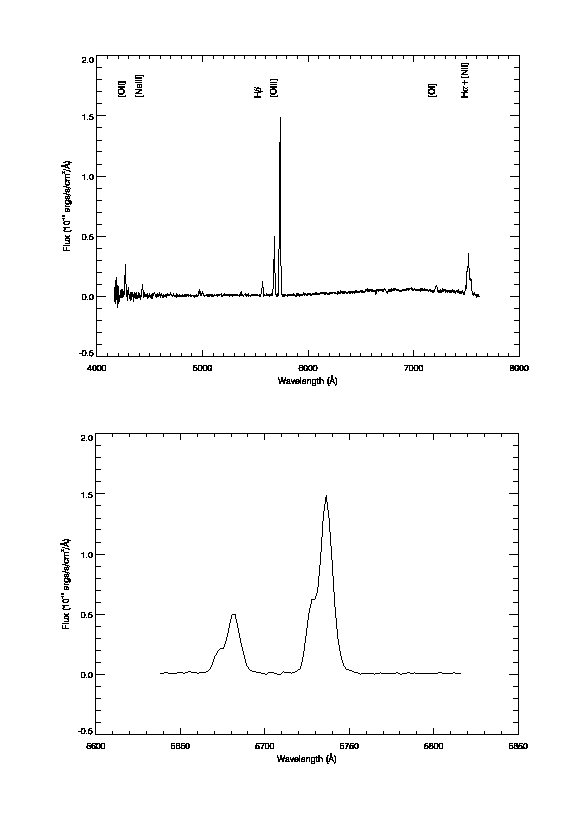
Figure 11: Spectrum of the host galaxy of NVSS 2146+82. The
upper panel shows the full spectrum, with several of the stronger
emission features identified in Table 4 are marked.
Most of the
emission lines have a double-peaked profile, as illustrated in the
lower panel with the [OIII] ![]() 4959, 5007 pair.
4959, 5007 pair.
An unusual feature of the spectrum (Figure 11) of the AGN is that all of the emission lines appear to be double peaked. The second panel in Figure 11 shows an expanded view of the [OIII] doublet clearly showing the double peaked profile of the emission lines. Each emission line was easily fit with a blend of two gaussians, indicating that AGN line emission is coming from two sources with a velocity separation of ~ 450 km s-1 .
Since the AGN emission line spectrum gives two different velocities, we have decided to take the velocity of the stellar component of the galaxy as the systemic velocity of the galaxy. The stellar absorption line redshift, calculated by cross-correlating the host galaxy spectrum with the spectrum of the star immediately to the east, is 0.1450Ý0.0002.
Table 4 lists the properties of the observed emission features in the spectrum of NVSS 2146+82. The redshifts of the AGN emission line components were calculated by identifying features and taking the average redshift of all of the identified features. In this way, the two AGN emission line components have been measured to be at velocities of 40070Ý50 km s-1 and 40520Ý50 km s-1 , which corresponds to redshifts of 0.1440Ý0.0002 and 0.1456Ý0.0002 respectively. This indicates that the gas which is giving rise to the bluer component of the AGN emission line spectrum is moving relative to the stars in the AGN host galaxy at -280 km s-1 and the gas emitting the redder lines is moving at 170 km s-1 with respect to the stars.
Each emission feature identified in Table 4 was fit with a blend of two
gaussian components (except for the two weak lines [NeIII] ![]() 3967 and [OIII]
3967 and [OIII] ![]() 4363, where a single gaussian was used) to determine the line
flux. The fluxes listed in Table 4 were measured
after the spectrum of NVSS 2146+82 was flux calibrated using the
average of four measurements of the calibrator Feige 34. The flux of
the calibrator varied significantly among our four separate exposures,
and we therefore estimate our spectrophotometry is only accurate to
about 20%. In addition to calibration error, there is an additional
error in the profile fitting, and therefore the errors listed for the
fluxes include both calibration and measurement error.
4363, where a single gaussian was used) to determine the line
flux. The fluxes listed in Table 4 were measured
after the spectrum of NVSS 2146+82 was flux calibrated using the
average of four measurements of the calibrator Feige 34. The flux of
the calibrator varied significantly among our four separate exposures,
and we therefore estimate our spectrophotometry is only accurate to
about 20%. In addition to calibration error, there is an additional
error in the profile fitting, and therefore the errors listed for the
fluxes include both calibration and measurement error.
We derived an extinction of AV = 0.9 Ý 0.9 (the large error is due mostly to the calibration error in the fluxes) using the standard Balmer line ratios for Case B recombination ([Osterbrock 1989]) and the extinction law of [Cardelli et al. (1989)]. The Galactic extinction at the position of NVSS 2146+82 is given as AV = 0.5 on the reddening maps of [Schlegel et al. (1998)]. This value is consistent with our Balmer line derived value, but possibly indicates that there may be some dust in the host galaxy itself. We decided to correct the measured line fluxes for reddening using the mean value we derived of AV = 0.9 . The errors listed in Table 4 for the fluxes do not include the error in the extinction determination.
Table 4: Emission Line Data for NVSS 2146+82
|
Species | Fluxa | Luminositya | ||||
| é | é | 10-15 erg/sec/cm2 | erg/sec h50-2 | |||
| [OII]
| 4262.5 | 0.1436 | 4269.6 | 0.1455 | 7.4Ý0.5 | 7.6Ý0.5 |
|
[NeIII] | 4425.3 | 0.1439 | 4432.6 | 0.1458 | 2.8Ý0.3 | 2.9Ý0.3 |
|
[NeIII] | 4545.1 | 0.1456 | 0.9Ý0.1 | 0.9Ý0.1 | ||
|
H | 4693.7 | 0.1443 | 4698.2 | 0.1454 | 0.3Ý0.1 | 0.3Ý0.1 |
|
H | 4963.9 | 0.1436 | 4971.9 | 0.1455 | 1.4Ý0.2 | 1.4Ý0.2 |
|
[OIII] | 4998.8 | 0.1457 | 0.8Ý0.1 | 0.8Ý0.1 | ||
|
HeII | 5360.8 | 0.1440 | 5367.5 | 0.1454 | 0.8Ý0.2 | 0.8Ý0.2 |
|
H | 5560.5 | 0.1438 | 5569.2 | 0.1456 | 3.0Ý0.4 | 3.1Ý0.4 |
|
[OIII] | 5672.4 | 0.1439 | 5681.6 | 0.1457 | 12.3Ý1.1 | 12.7Ý1.1 |
|
[OIII] | 5727.2 | 0.1439 | 5736.4 | 0.1457 | 35.7Ý3.2 | 36.9Ý3.3 |
| [OI] | 7206.2 | 0.1438 | 7217.4 | 0.1456 | 1.6Ý0.4 | 1.7Ý0.4 |
|
[NII] | 7493.7 | 0.1444 | 7505.4 | 0.1462 | 1.7Ý0.3 | 1.8Ý0.3 |
|
H | 7508.9 | 0.1442 | 7520.3 | 0.1459 | 8.9Ý1.0 | 9.2Ý1.0 |
|
[NII] | 7530.6 | 0.1438 | 7542.8 | 0.1457 | 5.1Ý0.6 | 5.3Ý0.6 |
|
a
These values have been dereddened using a value
of AV = 0.9. Errors include only calibration and
measurement error, error in reddening is not included. |
||||||