next up previous home.gif
Next: 4.1.3 Fitted total intensity features Up: 4.1 Comparison between models and data Previous: 4.1.1 values


4.1.2 Total intensity images and profiles

Figure 6: Contours of total intensity at a resolution of 0.75 arcsec, covering ± 27 arcsec from the nucleus. The contour levels are: $-$1, 1, 2, 4, 8, 16, 24, 32, 40, 48, 56, 64, 72, 80, 88, 96, 104 $\times $ 40 µJy/beam area. 
From top: model with Gaussian profile, model with spine/shear layer, VLA data.
\begin{figure}\epsfxsize =8.5cm
\epsffile{i075ctrs.eps}\end{figure}

Figure 7: Contours of total intensity at a resolution of 0.25 arcsec. The plot covers ± 10 arcsec from the nucleus.  The contour levels are $-$1, 1, 2, 3, 4, 6, 8, 10, 12, 14, 16, 20, 24 $\times $ 30 µJy/beam area. 
From top: model with Gaussian profile, model with spine/shear layer, VLA data.
\begin{figure}\epsfxsize =9cm
\epsffile{i025ctrs.eps}\end{figure}

Figs 6 and 7 show the predicted and observed images of Stokes I at 0.75 and 0.25 arcsec resolution, respectively.

Figure 8: Total intensity profile along the jet ridge line at 0.75 arcsec resolution. 
Full line: data; dashed line: SSL model; dotted line: Gaussian model.
\begin{figure}\epsfxsize =8.5cm
\epsffile{iloprof.eps}\end{figure}

Figure 9: Total intensity profile along the jet ridge line at 0.25 arcsec resolution. 
Full line: data; dashed line: SSL model; dotted line: Gaussian model.
\begin{figure}\epsfxsize =8.5cm
\epsffile{ihiprof.eps}\end{figure}

Profiles of I along the jet axis are given at these resolutions in Figs 8 and 9.
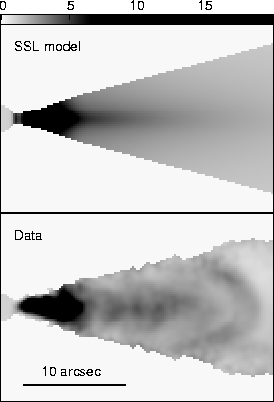
Figure 10: Grey-scale images of the observed (bottom) and SSL model (top) sidedness ratios at a resolution of 0.75arcsec. Both images use the same transfer function, which has been optimized to emphasize the variations in sidedness in the outer part of the jet. The sidedness images for the SSL and Gaussian models are very similar, so the latter is not shown.
\begin{figure}\epsfxsize =7.5cm
\epsffile{sided2.eps}\end{figure}

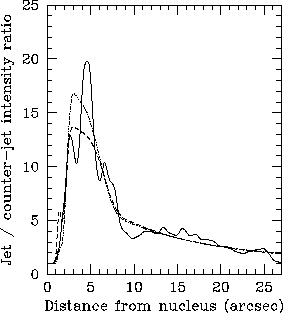
Figure 11: Profiles of jet/counter-jet sidedness ratio along the axis at a resolution of 0.75arcsec. Full line: data; dashed: spine/shear layer model; dotted: Gaussian model.
\begin{figure}\epsfxsize =8.5cm
\epsffile{sprof.eps}\end{figure}

The differences between the main and counter-jets are emphasized in sidedness images and profiles (Figs 10 and 11).


2002-06-13