 |

 |
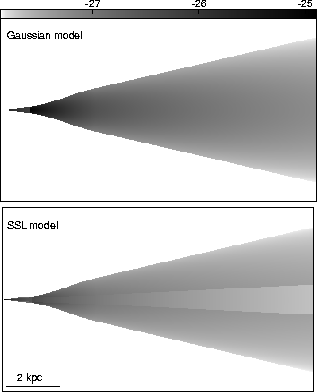
The spatial variation of
![]() (proportional to the
rest-frame emissivity) is shown as a grey-scale image in
Fig. 20 and as longitudinal profiles in Figs 17.
The emissivity is again poorly constrained in the inner region, and we can
only exclude very steep decreases with distance. For the shear layer, the
dependence of emissivity on distance is very different for the flaring
(
(proportional to the
rest-frame emissivity) is shown as a grey-scale image in
Fig. 20 and as longitudinal profiles in Figs 17.
The emissivity is again poorly constrained in the inner region, and we can
only exclude very steep decreases with distance. For the shear layer, the
dependence of emissivity on distance is very different for the flaring
(
![]() ) and outer (
) and outer (
![]() ) regions. The
relative contribution from the spine is small, so its emissivity could
vary either as a single power-law or in a manner closer to that of the
shear layer. The fractional emissivity at the edge of the shear layer is
consistent with a constant value of
) regions. The
relative contribution from the spine is small, so its emissivity could
vary either as a single power-law or in a manner closer to that of the
shear layer. The fractional emissivity at the edge of the shear layer is
consistent with a constant value of ![]() 0.2 in the flaring and outer
regions, although a much wider range (including zero) is allowed at the
inner boundary. There is strong evidence for a discontinuity in
emissivity at the inner boundary for the shear layer.
0.2 in the flaring and outer
regions, although a much wider range (including zero) is allowed at the
inner boundary. There is strong evidence for a discontinuity in
emissivity at the inner boundary for the shear layer.