 |

 |
 |
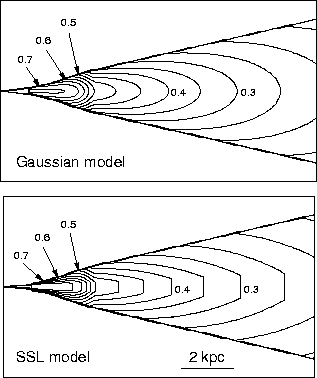
The inferred velocity field is shown as contour plots in
Fig. 18 and as longitudinal profiles in
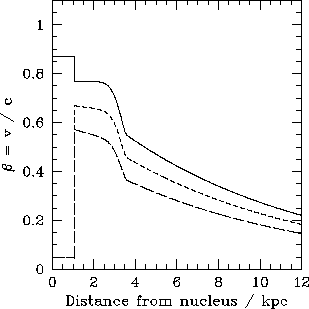
Fig. 19. The on-axis velocity
of the inner jet is poorly constrained, although extremely low values
(![]() ) are ruled out. The best fits show an abrupt decrease in
velocity across the inner boundary (Fig 19; see
Section 5.1 for a more detailed discussion), but continuity
cannot be entirely ruled out. Further out, the velocity field is much
better constrained (±0.1c and ±0.05c, for the
flaring and outer regions) and both models agree almost exactly. The
on-axis velocity remains roughly constant (
) are ruled out. The best fits show an abrupt decrease in
velocity across the inner boundary (Fig 19; see
Section 5.1 for a more detailed discussion), but continuity
cannot be entirely ruled out. Further out, the velocity field is much
better constrained (±0.1c and ±0.05c, for the
flaring and outer regions) and both models agree almost exactly. The
on-axis velocity remains roughly constant (
![]() ) between 1
and 2.5kpc and then drops abruptly to
) between 1
and 2.5kpc and then drops abruptly to
![]() at the outer boundary. Quantitatively, the exponent H in the
velocity law for the flaring region (Table 4) is required
to be > 3. Thereafter,
at the outer boundary. Quantitatively, the exponent H in the
velocity law for the flaring region (Table 4) is required
to be > 3. Thereafter, ![]() declines smoothly to
declines smoothly to ![]() 0.22 at 12 kpc.
0.22 at 12 kpc.
The transverse velocity profile is hardly constrained at all in the inner region. The best fits in the flaring and outer regions require an edge velocity close to 0.7 of the central value (Figs 18 and 19), independent of distance from the nucleus. The error analysis shows, however, that we cannot exclude a flat-topped profile at the inner boundary, so some evolution of the profile along the jet could occur. Very low velocities at the edge of the jet are not consistent with the observed sidedness ratios in these regions.