
The best-fitting spine/shear-layer models require the jets to be at
52![]() to the line of sight.
to the line of sight.
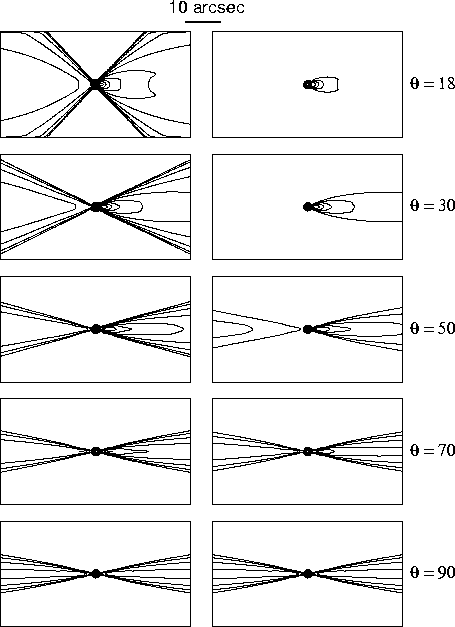 |
Fig. 23 shows the
appearance of these models if observed with the jet axis at other angles
to the line of sight at a resolution of 0.75arcsec. We have not
modelled the core, but need to make a crude estimate of the dependence of
its flux density on ![]() in order to illustrate the effects of
observing with limited dynamic range. For these calculations the
effective flow velocity in the core has been arbitrarily set at
in order to illustrate the effects of
observing with limited dynamic range. For these calculations the
effective flow velocity in the core has been arbitrarily set at ![]() (
(![]() ) and its flux is assumed to scale with angle
according to the predictions of a simple single-velocity model for a pair
of oppositely directed, identical jets:
) and its flux is assumed to scale with angle
according to the predictions of a simple single-velocity model for a pair
of oppositely directed, identical jets:
The left panels show how the jets would appear if they could be observed at these angles to the line of sight with the same limiting sensitivity as in our VLA data for 3C31, using logarithmically spaced contours.
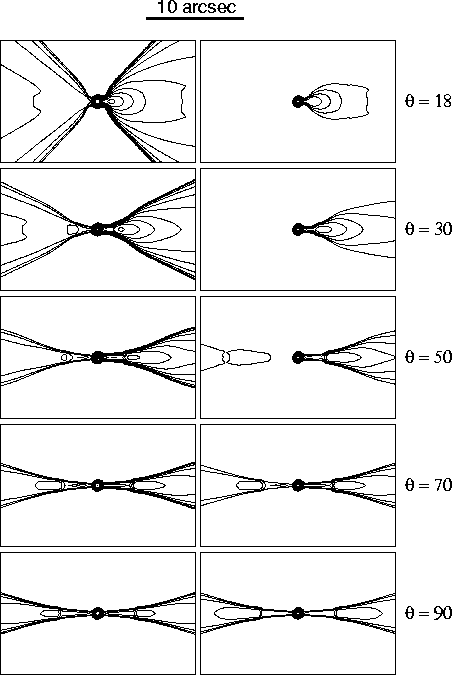 |
Fig. 24 shows a similar display for an observing resolution of 0.25arcsec FWHM, emphasizing the changes in appearance of the inner jet and the start of the flaring region.
The ![]() =90
=90![]() case is, of course, symmetrical with two identical
centre-brightened jets that lack well-defined intensity maxima at their
bases. Images of 3C449 (Feretti et al.1999) and PKS1333
case is, of course, symmetrical with two identical
centre-brightened jets that lack well-defined intensity maxima at their
bases. Images of 3C449 (Feretti et al.1999) and PKS1333![]() 33 (Killeen, Bicknell & Ekers 1986)
show precisely these features.
33 (Killeen, Bicknell & Ekers 1986)
show precisely these features.
At ![]() =70
=70![]() , we see the effects of moderate differences in the
Doppler boost between the two sides: the base of the main jet appears
brighter, and the counter-jet is both dimmer and less centrally-peaked
than the main jet (compare 3C296; Hardcastle et al. 1997 ). At
, we see the effects of moderate differences in the
Doppler boost between the two sides: the base of the main jet appears
brighter, and the counter-jet is both dimmer and less centrally-peaked
than the main jet (compare 3C296; Hardcastle et al. 1997 ). At
![]() =50
=50![]() , we see essentially the symmetries observed in
3C31's jets. Note that the counter-jet brightens on an absolute scale
at lower inclination angles
, we see essentially the symmetries observed in
3C31's jets. Note that the counter-jet brightens on an absolute scale
at lower inclination angles ![]() because each line of sight now
intersects a longer absolute path length through both jets. At
because each line of sight now
intersects a longer absolute path length through both jets. At
![]() =30
=30![]() , the bright base of the main jet is effectively
contiguous with the unresolved core, and at
, the bright base of the main jet is effectively
contiguous with the unresolved core, and at ![]() =18
=18![]() the
characterization of the structure as a ``jet" according to the usual
criteria (Bridle & Perley 1984) would be questionable at this resolution. By
the
characterization of the structure as a ``jet" according to the usual
criteria (Bridle & Perley 1984) would be questionable at this resolution. By
![]() =18
=18![]() , the apparent flux density of the core has also
increased from 0.03 Jy at
, the apparent flux density of the core has also
increased from 0.03 Jy at ![]() =90
=90![]() to 1.6 Jy. This makes it
unlikely that the wide-angle emission from the outer layers of the jet
would be detected except in observations specifically designed for high
dynamic range (or low angular resolution).
to 1.6 Jy. This makes it
unlikely that the wide-angle emission from the outer layers of the jet
would be detected except in observations specifically designed for high
dynamic range (or low angular resolution).
The right panels illustrate this by plotting the same five models with
logarithmically spaced contours at fixed percentages of the apparent peak
intensity, to a limit of 1/750 of the peak. The contours are chosen to
match the appearance of the left panel for the ![]() =90
=90![]() case.
These ``constant dynamic range'' displays probably correspond better to
``standard'' radio astronomical observations that have not been specially
optimized to detect faint broad features in the presence of strong compact
components. For
case.
These ``constant dynamic range'' displays probably correspond better to
``standard'' radio astronomical observations that have not been specially
optimized to detect faint broad features in the presence of strong compact
components. For ![]() =30
=30![]() and
and ![]() =18
=18![]() , most of the
emission detected outside the compact core comes from close to the spine
of the approaching jet. Images of BL Lac objects such as 3C371
(Wrobel & Lind 1990; Pesce et al. 2001) and Mkn501 (Conway & Wrobel 1995) show qualitatively similar
features, although the effects of projection exaggerate deviations from
axisymmetry.
, most of the
emission detected outside the compact core comes from close to the spine
of the approaching jet. Images of BL Lac objects such as 3C371
(Wrobel & Lind 1990; Pesce et al. 2001) and Mkn501 (Conway & Wrobel 1995) show qualitatively similar
features, although the effects of projection exaggerate deviations from
axisymmetry.
 |
Fig. 25 shows the variation of polarization with angle
at two different resolutions. The relative separation of the
parallel-perpendicular apparent field transitions in the main and
counter-jets from the nucleus is a strong function of inclination. For the
main jet, the transition point moves away from the nucleus into the
flaring region as ![]() drops from 90 to 45
drops from 90 to 45![]() , despite the
opposite effect of projection on the position of the flaring point. As
, despite the
opposite effect of projection on the position of the flaring point. As
![]() decreases still further, the transition moves closer to the
nucleus again. In contrast, the field transition in the counter-jet moves
monotonically closer to the nucleus as
decreases still further, the transition moves closer to the
nucleus again. In contrast, the field transition in the counter-jet moves
monotonically closer to the nucleus as ![]() decreases, with the
parallel-field region being essentially invisible for
decreases, with the
parallel-field region being essentially invisible for
![]() . The longitudinal apparent field at the edges of the jets also
becomes less prominent as
. The longitudinal apparent field at the edges of the jets also
becomes less prominent as ![]() increases, and would be difficult to
detect for
increases, and would be difficult to
detect for
![]() 90
90![]() in observations with limited
sensitivity. Both effects are inevitable consequence of the
toroidal/longitudinal field structure. We expect them to be general
features of FRI sources, testable for complete samples even where
detailed modelling is impossible because of intrinsic asymmetry or low
signal-to-noise. There is little published data on field transition
distances, but 3C296 (Hardcastle et al. 1997) and 0755+379 (Bondi et al. 2000) indeed
have transition points further from the nucleus in their main jets.
in observations with limited
sensitivity. Both effects are inevitable consequence of the
toroidal/longitudinal field structure. We expect them to be general
features of FRI sources, testable for complete samples even where
detailed modelling is impossible because of intrinsic asymmetry or low
signal-to-noise. There is little published data on field transition
distances, but 3C296 (Hardcastle et al. 1997) and 0755+379 (Bondi et al. 2000) indeed
have transition points further from the nucleus in their main jets.
Figs 23-25 explicitly demonstrate the possibility of generating a variety of apparent FRI jet structures with the same physical model by varying the orientation and of unifying FRI radio galaxies with some classes of ``one-sided'' objects. They also illustrate the need for careful consideration of observational selection effects when analysing statistical properties of unified models. In the presence of a range of flow velocities both along and across every jet, observational selection through limited sensitivity and dynamic range translates into velocity selection within the jets. A key byproduct of our models may be a way to guide the statistical interpretation of jet velocities in blazar-FRI unification models, as discussed by Laing et al.(1999).
The analysis of jet sidedness and width ratios for a complete sample by Laing et al. (1999) shows that our models are likely to apply in detail to the inner parts of the majority of FRI jets (i.e. before bending and other intrinsic effects become dominant). The results of Laing et al. (1999) suggest that some model parameters vary systematically from source to source: in particular, the length of the inner region and the characteristic scale of deceleration appear to increase with radio luminosity